|
Is it me, or does Facebook just want to keep you on Facebook? Every time I post a link to my site, I get less and less traffic. And it’s been this way for years. In other words, my organic reach on Facebook was dying. And to make matters worse, they give you hope every time they launch a new feature. For example, when they launched Facebook Live, you used to be able to get tons of views because they promoted it organically… but not really anymore. The same goes with Facebook Watch. I used to easily get 30,000 plus views per video when Facebook Watch came out… again, not anymore. Now I am lucky to get 10,000 views. But hey, I can’t really hate on Facebook. They are a business and they have to do what’s best for them. So instead of getting upset at Facebook, I decided to run some tests to see if I could find a way to get more organic traffic. Because there has to be a way, right? Well, there is. And here is my traffic from Facebook over the last 7 days:
That may not seem like a big increase, but I generated 10,621 visitors the month before. In other words, I took my Facebook traffic from 10,621 visitors PER MONTH to 10,085 visitors PER WEEK. I am getting roughly the same amount of traffic I used to get in 30 days from Facebook, now in just 7 days. So how did I do this? Taking control of your own destinyAs marketers, our faith typically relies on the big giants… you know, Google, Facebook, YouTube, Instagram… If they decide to change their algorithms your traffic could go up, down, or stay flat. For that reason, over the last few years, I’ve been building up marketing channels that aren’t as reliant on algorithms. For example, you may learn about new blog posts I publish through my email lists because every time I publish a new post, I usually send out an email blast. Or it could be through browser notifications.
Every time I release a blog post or a video… again, I send a message out through push notifications. But why can’t we do the same with Facebook? Sure, you can post on your wall or page like everyone else, but if Facebook doesn’t want to show it to people they don’t have to. So, I decided to push really hard on Facebook Messenger, which gives you the same ability. In other words, you can send a direct message to everyone on Facebook through their chat feature and share a message or a link to your website. Something that isn’t too controlled by an algorithm… similar to text messaging or email marketing. I built this list of 129,560 Facebook Messenger contacts and leveraged them to continually generate traffic back to my blog. Now before I break down the exact steps I took to do this, the tactics here take execution and elbow grease. It isn’t rocket science, it’s not hard to do, but it does take a bit of work. But first, let’s go over how Facebook Messenger marketing works. Facebook Messenger
First, let’s back up on why Facebook Messenger is working so well today. Facebook Messenger open rates are 50-80% click-through rates post elite stats. When you send an email campaign, you can expect a 20% open rate on a really good day. On average, I get 28 to 31% with my NeilPatel.com email list. In other words, if you send your email newsletter to 100 people, 20 people will open it. If you scrub your list and work really hard like me, roughly 30 people will open it, which still isn’t great. However, when you send a Messenger message to 100 people, 88 people will open it and read it. We’re talking about an 88% open rate on Messenger. That is crazy!!!! Now over time, you will notice that it will go down, but it is still substantially higher than email. But here is where it really gets interesting. With email marketing, you’ll typically see a 2% to a 4% click-through rate. So for every 100 emails you send, you will get 2 to 4 clicks back to your site. To give you a benchmark, again, I spend a lot of time fine-tuning my emails and I can get about 6 clicks for every 100 emails I send. Better than the 2 to 4 percent most people get, but still not life-changing. With Messenger? You can get 20% click rates. Over time, you will see it go down, but it is still substantially higher than email marketing. And it is not just marketing, it works with pretty much any industry. Here’s an example of a real estate company that leverages Facebook Messenger:
As you can see from the screenshot above, Facebook Messenger works like how you would chat with a friend on Facebook or even email. You don’t always have to promote or link, you could just have a conversation with a friend. This is why their adoption rate is continually climbing in the United States.
That’s almost 140 million users that are projected to use Messenger. Messaging apps are also surpassing social networks in popularity. Just ask yourself… how many times do you use WhatsApp each week?
But the key is to start now because it will become saturated just like every other marketing channel that works. So whoever builds the biggest list early on will have the best shot of doing well in the long run. If you are already leveraging Messenger, great, just skip to the tips below to start growing your Facebook traffic. If you aren’t, just like email marketing you are going to need software so you can send the messages on Facebook. You can start off with this free software called MobileMonkey. Now let’s get into how you can build your Messenger list and get consistent Facebook traffic. Tactic #1: Website Messenger widgetMy own tests have shown that chat on a website can boost conversions 45%. So I wondered, what would happen if I installed a Messenger bot on a website? What’s great about adding this is that visitors get answers to their questions immediately, 24/7. Say goodbye to conversion bottlenecks. But also, everyone who starts a chat on the site becomes a new contact in my Messenger list. So how does this work? Add a Facebook Messenger bot to your website with a widget. Everyone who visits your website is invited to become a Messenger contact. Website traffic turns into Messenger contacts. Most users are already logged into Messenger on their desktop or device. So when they have questions or want info and see the Messenger widget, they tap it and boom — new Messenger contact.
If your site is on WordPress site like 34% of the world’s sites, a WordPress plugin called WP-Chatbot is the quickest way to add Facebook Messenger chat to your site.
Install the plugin on your WordPress site and you’ll have Messenger chat on your site in just a few minutes. This widget makes list building easy. An active website could get hundreds or thousands of new contacts from the visitors on the site who engage the chatbot every day. Think about yourself. Are you more likely to search for a contact form on a site, fill it out, and sit back and wait who knows how long for an answer to your question? Or are you more likely to pop open the chat window, ask your question, and get an immediate response? Tactic #2: Run Facebook click to Messenger adsYou can do a lot without leveraging paid traffic, but if you really want to put some fuel on the fire, a few hundred dollars goes a long way. And for the purpose of this blog post, I spent $391.58 just so I would have some stats to share with you. Facebook Messenger ads are a Facebook Ad format in which the user who clicks on the ad is immediately added to your Messenger contact list as opposed to going to a landing page where they may bounce or exit, anonymously. Everyone who clicks the button on the ad converts when they send the advertiser a message — becoming a permanent Messenger contact. The key part is… they need to send the advertiser a message. In other words, if you don’t get them to send you a message they won’t be added to your Messenger contact list so you won’t be able to send blasts to them. That’s why you want to use an autoresponder. If which you automatically start talking to each person to increase your chance that they will get added to your contact list. Here’s an example of an ad:
How much will Facebook click-to-Messenger ads run you? I personally haven’t scaled a campaign too large yet, but with a $391.58 test budget, I’ve been able to generate leads for roughly 62% less than traditional Facebook ads. But again, the key with all of this is in the autoresponder. Without that, your numbers won’t be too great. Within MobileMonkey, use the bot content builder to create the autoresponder to your Facebook Ad.
Then create a new Messenger ad in MobileMonkey to connect your autoresponder to your Facebook Ad.
Next, pick the autoresponder from a drop-down of all your bot dialogues and connect it to your Facebook Ads Manager account.
The result is a low-cost ad campaign that drives more contacts into your Messenger list. Facebook Messenger ads work time and again across industries, including e-commerce and service businesses. Now, if you are like me and you prefer to do things a bit more organically and save some money, here’s how you generate more contacts without spending money. Tactic #3: Use organic Facebook post autorespondersGrowing your list with a little ad spend goes a long way, but this next list building power tactic is totally free. Anyone who comments on your Facebook Page posts instantly becomes your Messenger contact. A Facebook post autoresponder adds people to your Messenger contact list if they comment on any Facebook post. Here’s how it works.
You can see an example of this tactic in action here:
The more engaging your Facebook post, the more likely it will be that people will want to comment on it. These kinds of posts always get a ton of comments and contacts:
You could ask fans to post a GIF in response to a question. “Describe your boss with a GIF.” Or ask them to tell a story or ask them a question like “What industry are most of your clients in?” Even just asking them “what do you do?” is super-engaging because people love to talk about themselves! This store asks fans to name how many duck species are in the photo. Comment with your guess and get a discount code in the autoresponder follow-up.
You can create the Messenger dialog for this technique in MobileMonkey with the “FB Comment Guard” tool.
That feature is what allows you to add the autoresponder to an organic post. I love this technique because it converts my hard-fought organic Facebook engagement into a list of contacts I can follow up with. Tactic #4: Convert page fans into Messenger contactsI’m a fan of cross-promoting, traffic-sharing, and allowing various marketing channels to build off each other. After all, if someone follows you on one channel, they may want your updates on a different channel as well. This increases your odds of connecting with them and amplifying your content reach at any given time. This tactic combines several methodologies for a boost to Messenger contacts. If you’ve gone to the effort of building a robust Facebook page, you will want to convert these fans into Messenger contacts. Fans are great, but Messenger contacts are better because Messenger is personalized, interactive, one-on-one, and has way more visibility than Facebook News Feed. Organic reach on Facebook is very low. Maybe 1%, of your fans on your Facebook Page will even see your post. Using Facebook Messenger changes this. Instead of a low organic reach, you’re getting high-powered interactions that are personalized. This is important because page fans aren’t automatically Messenger contacts. You have to invite them or connect with them in Messenger first. Here are three ways to convert your Page fans into Messenger contacts. First, and this one is pretty obvious, you can change the CTA button on your Facebook Page to “Send Message”. Right now your Facebook Page CTA button might be sending traffic to your site with a button like “Learn More”.
Hover over the button until you see “Edit Button.” Then choose the option to “Contact you” and “Send Message.”
Customize the message that people will see when they click that button in MobileMonkey.
Boom. Now anyone who clicks the “Send Message” button from a Facebook Page will become a Messenger contact. Second, create a Facebook Post Autoresponder (see tip #3). This autoresponder was a simple invitation — Stay in touch! Sign up for Messenger updates. Third, you can then use Page fan audience targeting of a click-to-Messenger Facebook Ad campaign.
Remember, your existing Page fans are more likely to take another step into more interaction with a brand that they know and trust. Tactic #5: Turn your email subscribers into Messenger contactsEmail marketing has a low engagement rate. Facebook Messenger has high engagement. Would you rather send your content to your subscribers in a channel with a 2% click-rate or 20% click-through rate? Ideally, you should do what I do and leverage them both. Send your email list an invitation to join your Facebook Messenger list. Those who choose to do so will become email subscribers and Messenger subscribers, but their engagement level (and therefore your reach) will increase using Messenger. One of the most effective marketing methods is to convert your existing contacts into more effective marketing channels. Using MobileMonkey’s chatbot builder, you can create an opt-in page consisting of a quick and simple “Want to receive occasional updates?” invitation. Link to that invitation anywhere you’d normally include a link. Link to that invitation in a button, like the examples below.
And here:
Link to your Messenger experience in your:
The list is as long as you are clever. And it works very well! ConclusionYou are always going to deal with algorithms, but if you want more consistent traffic you need to take matters into your own hands. Just look at me, I leverage email marketing, push notifications, and even Facebook Messenger marketing. I’m now looking into leveraging text messaging too. Sure, I leverage SEO, content marketing, paid ads, social media marketing… and every other major channel out there. But I focus a large part of my efforts on controlling my own destiny and you can too. If you haven’t started, start with Facebook Messenger. It works so well right now and I expect it to last for a while. The key is getting in on the right time and time is right now. So what do you think about this strategy? Have you tried Facebook Messenger marketing yet? The post How I Grew My Dying Facebook Traffic appeared first on Neil Patel. The post How I Grew My Dying Facebook Traffic appeared first on Projabez Media – Digital Marketing Agency. From https://projabez.com/how-i-grew-my-dying-facebook-traffic/ from https://projabezmediadigitalmarketingseoagency.wordpress.com/2019/07/20/how-i-grew-my-dying-facebook-traffic/ from https://digitalmarketingagencymiltonkeynes.blogspot.com/2019/07/how-i-grew-my-dying-facebook-traffic.html from https://agencymilton.tumblr.com/post/186415681714 from https://localseomarketingmiltonkeynes.blogspot.com/2019/07/how-i-grew-my-dying-facebook-traffic.html from https://localseomarket.tumblr.com/post/186416617212 from https://freddurbin.blogspot.com/2019/07/how-i-grew-my-dying-facebook-traffic.html
0 Comments
When you log into Google Analytics, what do you look at? Chances are you see something like the image above that shows you how many people are currently on your blog. Well, that was easy to guess because that’s the report Google Analytics gives you once you log in. But which reports do you look at on a regular basis? I bet you look at two main reports… The “Audience Overview” report and the “Acquisition Overview” report.
Sure, every once in a while, you may dive into your top pages or the specific organic keywords that drive your traffic. But even if you do that, what are you actually doing with the data? Nothing, right? Don’t beat yourself up over it because most content marketers just look at reports and numbers and do little to nothing with the data. If you want to figure out how to grow your blog and, more importantly, your revenue from your blog, there are 7 reports that you need to start looking at on a regular basis. Here they are and here is how you use them… Report #1: Cohort AnalysisWhat do you think is easier to accomplish… get new visitors to your blog or getting your visitors to come back? It’s easier to get people to come back to your blog, yet everyone focuses on new visitors. I bet less than 99% of your blog readers turn into customers or revenue, so why not focus on getting those people back and eventually converting them? Before we get into how to get people back to your blog, let’s look at how many people are returning to your blog. Within the Google Analytics navigation, click on “Audience” and then “Cohort Analysis”. Once you land on that report, you’ll see a graph that looks similar to this:
Under the “Cohort Size” drop-down menu, select “by week”. Under “Date Range”, select “Last 12 weeks”. Once the data loads, you’ll see a table that looks something like this:
What this table shows is the percentage of your visitors that come back each week. On the very left it will always show 100%. Then in the columns to the right, you’ll see week 1, week 2, week 3, etc. This shows the percentage of people who come back to your blog each and every week after their first visit. For example, if this week you had 100 people visit your blog and in the week 1 column, it shows 17%. That means of the initial 100 people, 17 came back. Under week 2 if you see 8%, that means of the initial 100 people, 8 people came back in week 2. Naturally, this number will keep getting smaller, but the goal is to get people back as often as possible. That increases trust, social shares, potential people linking to you, and it even increases the odds that the visitor will convert into a customer.
The average blog reader needs to come back 3.15 times before they turn into a customer. That means that you need to retain readers. Just think of it this way: If you get thousands of new people to your blog each and every single day but none of them ever come back, what do you think is going to happen to your sales? Chances are, not much. You need to look at your Cohort Report and continually try to improve the numbers and get people coming back. So the real question is, how do you get people to come back? There are 2 simple ways you can do this:
These 2 strategies are simple and they work. Just look at how many people I continually get back to my blog through emails and push notifications.
Report #2: BenchmarkingEver wonder how you are doing compared to your competition? Sure, you can use tools like Ubersuggest, type in your competitors URL, and see all of the search terms they are generating traffic from.
But what if you want more? Such as knowing what percentage of traffic your competitors are getting from each channel. What’s your bounce rate, average session duration, or even pageviews per channel?
Within Google Analytics navigation, click on “Audiences” then “Benchmarking” then “Channels”. Once you do that, you’ll see a report that looks like the one above. Although you won’t have specific data on a competing URL, Google Analytics will show you how you stack up to everyone else within your industry. I love this report because it shows you where to focus your time. If all of your competitors get way more social traffic or email traffic, it means that’s probably the lowest hanging fruit for you to go after. On the flipside, if you have 10 times more search traffic than your competition, you’ll want to focus your efforts on where you are losing as that is what’ll probably drive your biggest gains. The other reason you’ll want to look at the Benchmarking Report is that marketers tend to focus their efforts on channels that drive the most financial gain. So, if all of your competition is generating the majority of their traffic from a specific channel, you can bet that channel is probably responsible for a good portion of their revenue, which means you should focus on it too. Report #3: Location, location, locationHave you noticed that my blog is available in a handful of languages?
Well, there is a reason for that. I continually look at the location report. To get to it, click on “Audience” then “Geo” and then “Location”.
This report will tell you where the biggest growth opportunities are for your blog. Now with your blog, you’ll naturally see the most popular countries being the ones where their primary language is the one you use on your blog. For example, if you write in English, then countries like the United Kingdom and the United States will be some of your top countries. What I want you to do with this report is look at the countries that are growing in popularity but the majority of their population speak a different language than what you are blogging on. For me, Brazil was one of those countries. Eventually, I translated my content into Portuguese and now Brazil is the second most popular region where I get traffic from. This strategy has helped me get from 1 million visitors a month to over 4 million. If you want step-by-step instructions on how to expand your blog content internationally, follow this guide. Report #4: Assisted conversionsHave you heard marketers talk about how blog readers don’t convert into customers? It’s actually the opposite.
Those visitors may not directly convert into a customer, but over time they will. But hey, if you have a boss or you are spending your own money on content marketing, you’re not going to trust some stats and charts that you can read around the web. Especially if they only talk about long-term returns when you are spending money today. You want hard facts. In other words, if you can’t experience it yourself, you won’t believe it. That’s why I love the Assisted Conversions Report in Google Analytics. In the navigation bar click on “Conversions” then “Multi-Channel Funnels” and then “Assisted Conversions”. It’ll load up a report that looks like this:
This report shows you all of the channels that help drive conversions. They weren’t the final channel in which someone came from but they did visit your blog from one of these channels. In other words, if they didn’t visit or even find your blog from one of these sources, they may not have converted at all. Now when your boss asks you if content marketing is worth it, you can show the Assisted Conversions Report to show how much revenue your blog helps drive. The other beautiful part about this report is that it tells you where to focus your marketing efforts. You want to focus your efforts on all channels that drive conversions, both first and last touch. Report #5: Users flowWhat’s the number one action you want your blog readers to take? I learned this concept from Facebook. One of the ways they grew so fast is they figured out the most important action that they want people to take and then they focused most of their efforts on that. For you, it could be someone buying a product. For me, it’s collecting a lead and that starts with a URL. But I found that people interact with my blog differently based on the country they are coming from. In other words, if I show the same page to a United States visitor and from someone in India or even the United Kingdom, they interact differently. How did I figure that out? I ran some heatmap tests, but, beyond that, I used the Users Flow Report in Google Analytics.
In your navigation click on “Audience” and then “Users Flow”. Within the report, it will break down how people from each country interact with your blog and the flow they take. I then used it to adjust certain pages on my blog. For example, here is the homepage that people in the United States see:
And here is the homepage that people from the United Kingdom see:
The United Kingdom homepage is much shorter and doesn’t contain as much content and that’s helped me improve my conversions there. And of course, in the United States, my audience prefers something else, hence the homepages are different. The Users Flow Report is a great way to see how you should adjust your site based on each geographical region. Report #6: Device overlapBlog content can be read anywhere and on any device. From desktop devices to tablets to even mobile phones. The way you know you have a loyal audience isn’t just by seeing how many of your readers continually come back, but how often are they reading your blog from multiple devices. For example, you ideally want people to read your blog from their iPhone and laptop. The more ways you can get people to consume your content, the stronger brand loyalty you’ll build, which will increase conversion. Within the navigation, click on “Audience” then “Cross Device” and then “Device Overlap”.
I’m in the B2B sector so my mobile traffic isn’t as high as most industries but it is climbing over time. And what I’ve been doing is continually improving my mobile load times as well as my mobile experience to improve my adoption rates. I’m also working on a mobile app. By doing all of these things, people can consume content from NeilPatel.com anywhere, which builds stickiness, brand loyalty, and then causes more assisted conversions. A good rule of thumb is if you can get the overlap to be over 6%, you’ll have a very sticky audience that is much easier to convert. That’s at least what I can see with all of the Google Analytics accounts I have access to. Report #7: User ExplorerTo really understand what makes your blog readers tick, you need to get inside their mind and figure out what their goals are and how you can help them achieve each of those goals. A great way to do this is through the User Explorer Report. Click on “Audience” and then “User Explorer”. You’ll see a screen that looks like this:
This shows you every user who visits your site and what they did. You can click on a client id to drill down and see what actions each user performed on your blog.
From there, you can click on a time to see exactly what they did each time they visited:
What I like to do with this report is to see how the most popular users engage with my blog. What are they reading? What pages are they spending the majority of their time on? What makes them continually come back? How did they first learn about my blog? By comparing the most popular blog readers with the least popular, I am typically able to find patterns. For example, my most loyal blog readers typically find my site through organic traffic and then subscribe to my email list. Then they keep coming back, but the key is to get them to opt into my email list. That’s why I am so aggressive with my email captures. I know some people don’t like it, but I’ve found it to work well. So I focus a lot of my efforts on building up my organic traffic over referral traffic and then collecting emails. Look at the patterns that get your most popular users to keep coming back and then adjust your blog flow so that you can create that pattern more often. ConclusionYes, you should look at your visitor count. But staring at that number doesn’t do much. The 7 reports I describe above, on the other hand, will help you boost your brand loyalty, your repeat visits, and your revenue. I know it can be overwhelming, so that’s why I tried to keep it to just 7 reports. And if you can continually improve your numbers in each of those reports, your blog will continually grow and eventually thrive. So what Google Analytics reports do you look at on a regular basis? The post 7 Google Analytics Reports That Show How Your Blog is Really Performing appeared first on Neil Patel. The post 7 Google Analytics Reports That Show How Your Blog is Really Performing appeared first on Projabez Media – Digital Marketing Agency. From http://projabezmediadigitalmarketing.blogspot.com/2019/07/7-google-analytics-reports-that-show.html from https://projabezmediadigitalmarketingseoagency.wordpress.com/2019/07/19/7-google-analytics-reports-that-show-how-your-blog-is-really-performing-2/ from https://digitalmarketingagencymiltonkeynes.blogspot.com/2019/07/7-google-analytics-reports-that-show_19.html from https://agencymilton.tumblr.com/post/186404677009 from https://localseomarketingmiltonkeynes.blogspot.com/2019/07/7-google-analytics-reports-that-show_19.html from https://localseomarket.tumblr.com/post/186405814322 from https://freddurbin.blogspot.com/2019/07/7-google-analytics-reports-that-show_19.html
The social web is huge. From Facebook to Pinterest, they all command billions of eyeballs per year. Which, of course, makes these channels too big to ignore. In other words, you have no choice but to participate in them or else you’ll miss out on traffic and revenue. But, how much time and money should you devote to each social network? Which ones produce the best ROI? How much are 100 social media followers really worth? To answer these questions and more, I polled 483 companies who are all leveraging Facebook, YouTube, Instagram, Twitter, LinkedIn, and Pinterest. Each company has been participating in all these social networks for at least 3 years and they have at least 100 social media followers on each platform. Of the 483 companies, 159 of them were in the B2B space and 324 were B2C companies. And their revenues varied from $10,000 a year to $250,000,000. Now before we dive into the data, keep in mind all of the stats are broken down based on 100 social followers. For example, if we looked at traffic, we looked at how many visitors they generate per 100 followers. And for the purpose of this blog post, we will focus only on organic social media traffic. So, let’s dive into what we learned: Social media traffic over timeCompared to when each social network originally came out, it’s become much harder to generate organic traffic from each of them. You can still generate organic visits, but of course, reach has died down. But how much has it died down?
As you can see, it has drastically decreased. In 2015, you could generate a bit more than 3 visitors a month from the social web for every 100 followers you had, and now it’s dropped down to roughly 2 visitors per month. I know that data isn’t shocking, but think of it this way, that’s a 38.6% drop in organic social media traffic. And based on the chart, there are no signs of recovery. But what about traffic by social network?Sure, organic social media traffic might be dying as each network wants you to advertise, but which networks drive the most traffic per 100 followers? If you had to take a guess, which one do you think it would be?
It’s definitely not a social network owned by Facebook. Both Facebook and Instagram drive the least amount of visitors per 100 followers. Instagram isn’t much of a shocker, though, as you can only drive traffic through bio links and asking people to swipe up in stories. But what was surprising is the amount of traffic Pinterest drives. Pinterest was the best performer, followed by LinkedIn and then YouTube. Here’s the thing to note about YouTube… although it drives a decent amount of visitors per 100 subscribers, most people using YouTube don’t experience much (if any) traffic because they don’t link out to their site within their videos. You can use YouTube annotations to do this. Does posting more often mean more social traffic?The first chart shows that organic social traffic is slowly dying down, but how about if you increase your posting frequency? That should increase your organic social media traffic, right?
In general, posting more often does lead to more traffic. But after 8 monthly posts on each social network, the data shows you’ll see diminishing returns. Why you may ask? The way most social media algorithms work is that the more people engage with your content, the more of them will see your content as you post it. So, your goal should be to only post content people love and want to engage with. The moment you start posting mediocre content, it hurts your overall traffic numbers because that means fewer people in the future will see your new content no matter how amazing it is. Speaking of engagement, which social networks tend to have the most engaged users? Engagement by social networkI was shocked by the engagement stats because I assumed that Pinterest would have won in this battle as they are driving the most traffic per 100 followers to websites. But I was wrong.
Pinterest did perform really well, but LinkedIn won. Instagram also did extremely well, which I wasn’t shocked by as most of the people I know who use it do so as a “personal” social network instead of leveraging it for work. That’s why the engagement is so high on Instagram. One thing to note is that posts not containing a link, such as images or videos, tend to get the most engagement. This is also because social sites tend to promote content that keeps people on their social sites as opposed to driving their visitors off to your site. Which social networks prefer videos?If you aren’t producing videos, you should definitely consider starting. Even though videos don’t rank well on Google, they are the future. It’s why I create more video content each week than text-based content. With video, there are 2 main types of videos… one that you just upload and ones that are live. Let’s see how the different video types stack up against each other.
When you look at the chart above, it’s easy to say that Instagram produces the best results for videos. Then come LinkedIn and YouTube. But there is something that you have to keep in mind… Instagram auto-plays videos while YouTube is much pickier about what they count as a “video view.” None-the-less, if you’re going to create video content, you should post it on all of the social networks out there, but I would first focus the majority of your efforts on Instagram, LinkedIn, and YouTube. YouTube won’t provide amazing numbers in the first 24 hours of uploading a video, but through YouTube SEO, you can continually get views while you won’t see that happen on any of the other social networks. For live videos, the results are similar in which Instagram and YouTube lead the pack.
But what is interesting is that live videos don’t generate as many viewers as just posting and scheduling them. When we dug into why the main reason wasn’t that social sites don’t want live content, it’s that with non-live videos, businesses spend more time leveraging keyword research and optimizing their videos for the maximum amount of views. While on the flip side it is a bit harder to do that with live videos. If you want to get the most views from your videos, use tools like Ubersuggest to see what keywords are popular. Putting keywords in your title and descriptions isn’t enough, though. Social media sites are able to decipher the sound to see what your video is really about. Now let’s get into the best part… conversions and sales. The money is in the listHave you heard the saying, the money is in the list? If you aren’t collecting emails, you should start right away. Because once you have an email list, you can always market to people on your list and convince them to buy your products or services.
LinkedIn has the best conversion rates from a visitor to an email subscriber. Pinterest and YouTube also perform really well. You may think that most of the people on LinkedIn only care about B2B but that is wrong. Remember everyone on LinkedIn is also a consumer. They buy everyday products just like you and me. What was interesting with the email collection numbers is that the majority of your social media followers won’t ever convert into email subscribers. But as you share and post content on the social web, the followers of your followers may also see your content, which then increases the likelihood of getting more traffic and email subscribers. What about revenue?Whether you love or hate social sites, they do drive revenue. And no you don’t have to spend money on ads to generate revenue. Ads do help, of course, but here is the percentage of revenue that each business generated from organic social media traffic.
It’s been declining over the years, but the numbers are starting to flatten out. The decline isn’t just related to social media algorithms becoming tougher, though. It’s that businesses are also diversifying their marketing approach. They are taking an omnichannel approach which means they leverage more channels. Because of that, each one also makes up a smaller portion of their revenue. ConclusionSocial media is still strong and kicking. You may only be able to generate 2 visitors a month for every 100 followers you have, but that scales as you grow your social following on every network. Plus, the brand effect you can get by doing things like uploading videos will also help significantly. Now before we wrap things up, I thought it would be interesting to see what percentage of social media traffic is generated from organic efforts versus paid:
There is a huge trend of companies spending more and more money on social media, which aligns with the stock price and financials of companies like Facebook, Pinterest, and Twitter. None-the-less, don’t be discouraged by your social media traffic dwindling down. If you get a bit creative and follow this, you can spike your numbers. So, what are your social followers worth to you? The post New Study: What 100 Social Media Followers Are Really Worth appeared first on Neil Patel. The post New Study: What 100 Social Media Followers Are Really Worth appeared first on Projabez Media – Digital Marketing Agency. from From http://projabezmediadigitalmarketing.blogspot.com/2019/07/new-study-what-100-social-media.html from https://projabezmediadigitalmarketingseoagency.wordpress.com/2019/07/19/new-study-what-100-social-media-followers-are-really-worth-2/ from https://digitalmarketingagencymiltonkeynes.blogspot.com/2019/07/new-study-what-100-social-media_19.html from https://agencymilton.tumblr.com/post/186404676919 from https://localseomarketingmiltonkeynes.blogspot.com/2019/07/new-study-what-100-social-media_19.html from https://localseomarket.tumblr.com/post/186405814097 from https://freddurbin.blogspot.com/2019/07/new-study-what-100-social-media_19.html
What percentage of your search traffic is driven by your top 10 pages? Chances are, it’s a large portion. Just look at the screenshot below. You’ll see that my top 10 pages drive 28.7% of my search traffic.
That may not seem like a high number, but I have 5,441 blog posts. In other words, 0.1% of my pages make up 28.7% of my search traffic. Typically, with smaller sites, the percentages are much higher in which the top 10 pages make up the majority of their search traffic. So, what does that tell you? You should just focus on your top 10 pages and ignore the rest? Or, even worse, just focus on cranking out more new content? Quality over quantityI used to have the philosophy of “more is better.” I was cranking out dozens of articles each week. At one point, I was publishing 2 articles a day on this blog. And, over time, my traffic grew, but not by much. I was spending all of this time writing and realized that the majority of the content I was publishing never ranked. So, what did I do? I started focusing on my old, outdated content to boost my traffic. Just think of it this way: Every week I publish one new piece of content, but my team, on average, is updating 23 older articles. When I used to write more frequently, my top 10 pages made up 33% of my search traffic.
Since then, I have increased my search traffic by 107% and reduced my reliance on my top 10 pages by 13%. So how did I do this? Well, as I mentioned, I have my team focus on updating my old, outdated content while I focus on creating new content. Here’s exactly what I have my team implement, step by step. Look for pages that were once lovedWith Google Search Console, you have access to data for a much longer period of time. You can go back up to 16 months. So, I want you to compare this month’s results during the same period as last year. You can do this by clicking on “date” and then “compare.” Next, select your older date period first (should be roughly from a year ago) and then select today’s date period.
I’ve been doing this for a while, so I selected an older date range so you can see a better set of data before my team really focused on updating old content. You should then see a report that looks something like this:
What you’ll want to do is look for articles that used to get a ton of traffic and have less now. From the screenshot above, you can see that my article on Instagram used to perform really well, but no so much anymore. Keep in mind that I selected the older date range first. I did this to see which of my old pieces of content used to rank well so I can see if any of them have dropped over the last 12 months. This will show you old content that Google used to love, but no longer does. Now, let’s find content that Google never loved. Look for pages Google never lovedLog back into Search Console and look for pages that have a high impression count but never got any real clicks. The easiest way to find these pages is to set your date range to the last 28 days and look at each page’s metrics from an impression, click, and CTR perspective. Sort the CTR column in ascending order (lowest percentage at the top, the highest percentage at the bottom).
Typically, the pages at the top of that list have the most potential. It means that Google is ranking you but you just aren’t getting too many clicks. It usually isn’t just related to your title tag and meta description. It typically has to do with the content on the page. Now it’s time to create a list of pages that have the greatest potential. It’s time to prioritizeTypically, the pages that have the most potential are the ones that used to rank but no longer rank. Google used to rank and like them, which means if you give those pages a little tender loving care, you can easily get them loved by Google again. The second group of pages that have potential, but not as much as the first, are the ones with a high impression count but an extremely low CTR. These pages are harder to fix because they never really performed that well. How to update your old contentNow that you have a list of pages to fix so you can boost your search engine rankings, I want you to log in to Google Search Console, find that article, click on it, and then click on “queries.”
For the keywords that don’t rank in the top 5 or have a high impression volume, I want you to go to your ranking article and see if the article is relevant for that term. If not, adjust the article to at least include that term and cover that topic. For the terms you already rank for in the top 5 spots, head over to Ubersuggest and type in those keywords and click on the keyword ideas report.
You’ll then see a report with all of the long-tail variations of that keyword. If you adjust the article and include any of the long-tail phrases Ubersuggest gives you, you’ll see quick traffic gains. In other words, if you already rank for the head term, it’s not hard to rank for the long-tail variation of it as well. In addition to including the right keywords, you’ll want to update the post. Make sure all of the information is relevant, the pictures are up to date, and if you could include any multimedia (like embedding relevant YouTube videos) you’ll be able to increase the time on site of your visitors. Finally, when updating your content, make sure your article is more thorough than all of the other sites that rank for the terms you are trying to rank for. Remember that keyword ideas report I had you check out on Ubersuggest? On the right-hand side of that report, it shows you all of the sites that rank for that keyword.
You can quickly see who’s currently ranking in each country, visit their web page, and make sure you create something better. User metricsUser behavior is one of the biggest factors with Google’s algorithm. Once you update your old content, you’ll want to optimize for user signals as that’ll help boost rankings. A great example of user metrics is optimizing your title tags and meta description. For example, if everyone searched a keyword on Google and clicked on the second result instead of the first, it tells Google that the second result is more relevant and that it should be ranking in the first spot instead of the second. And Google eventually would make that change. If you can use persuasive copy and convince people to click on your search listing instead of the competition, eventually your rankings will climb. And you can do so by following these 2 articles:
Over the years, I’ve done a lot of title tag and meta description tests and I’ve also found that these keywords help increase clicks:
You can also use tools like Clickflow to A/B test your meta tags. Don’t forget to promote (again)Now that your content is up to date and you’ve optimized your meta tags for clicks, it’s time for you to promote your content. I know what you are thinking… why would you promote old content, right? Well, technically it isn’t old anymore. First of all, you should update the published date or last updated date within your WordPress.
That way search engines know your content is changed, more relevant, and up to date. Secondly, you need to promote the article. It’s new now, so why wouldn’t you share it with the world? The simplest thing you can do is share it on the social web. I typically share my content on Facebook, Twitter, and LinkedIn… but you can pick whatever social profiles you have. Although Google doesn’t really look at social signals, Bing does. Plus, some people who visit your page from the social web may decide to link to your article, which does help rankings. And if you want to go above and beyond, check out Meet Edgar. It’s what I use to continually schedule my old content to be promoted on the social web. That way I don’t have to manually do it or set reminders. In addition to social shares, you should consider sending out a text-based email blast to your audience promoting your content. It’s a great way to get a quick boost of traffic and breathe life into your old content. Here’s an example of a text-based email blast that I send so you can copy my format.
As you can see, simple text-based emails are generating 30% open rates and 6% click rates for me. Not too shabby. You can also use tools like Subscribers to send out a push notification. Every time I update a post I send out a push. Look at my stats… I can easily generate an extra 7,000 visitors from a single push.
And don’t forget to build linksThe last step you want to leverage is link building. You can use Backlinks to see who is linking to competing articles:
All you have to do is put in a competing URL and select “URL” from the drop-down menu and you’ll see every site that links to that page. From there, you’ll want to reach out to each site and ask them to link to you. The easiest way to do this is to leverage the skyscraper technique and the steps in this article. ConclusionOnce you hit the 150 mark in the number of pages on your site, you should consider focusing the majority of your time to updating old content instead of creating new content. If you have over 1,000 pages, you should definitely spend 80-plus percent of your time updating old content instead of writing new content. The key to ranking your old, outdated content is to first focus on the content that used to rank but doesn’t anymore. Once you fix those pages, you should see results within a month or two. From there, you can then focus on pages that have a high impression count but a low click count. So, are you going to focus your time on ranking your old content or creating new content? The post How to Rank Your Old, Outdated Content appeared first on Neil Patel. The post How to Rank Your Old, Outdated Content appeared first on Projabez Media – Digital Marketing Agency. from From http://projabezmediadigitalmarketing.blogspot.com/2019/07/how-to-rank-your-old-outdated-content.html from https://projabezmediadigitalmarketingseoagency.wordpress.com/2019/07/19/how-to-rank-your-old-outdated-content-2/ from https://digitalmarketingagencymiltonkeynes.blogspot.com/2019/07/how-to-rank-your-old-outdated-content_19.html from https://agencymilton.tumblr.com/post/186404676839 from https://localseomarketingmiltonkeynes.blogspot.com/2019/07/how-to-rank-your-old-outdated-content_19.html from https://localseomarket.tumblr.com/post/186405813902 from https://freddurbin.blogspot.com/2019/07/how-to-rank-your-old-outdated-content_19.html Welcome to WordPress. This is your first post. Edit or delete it, then start writing! The post Hello world! appeared first on Projabez Media – Digital Marketing Agency. from From http://projabezmediadigitalmarketing.blogspot.com/2019/07/hello-world.html from https://projabezmediadigitalmarketingseoagency.wordpress.com/2019/07/19/hello-world-2/ from https://digitalmarketingagencymiltonkeynes.blogspot.com/2019/07/hello-world_19.html from https://agencymilton.tumblr.com/post/186404676704 from https://localseomarketingmiltonkeynes.blogspot.com/2019/07/hello-world_19.html from https://localseomarket.tumblr.com/post/186405813747 from https://freddurbin.blogspot.com/2019/07/hello-world_19.html
When you log into Google Analytics, what do you look at? Chances are you see something like the image above that shows you how many people are currently on your blog. Well, that was easy to guess because that’s the report Google Analytics gives you once you log in. But which reports do you look at on a regular basis? I bet you look at two main reports… The “Audience Overview” report and the “Acquisition Overview” report.
Sure, every once in a while, you may dive into your top pages or the specific organic keywords that drive your traffic. But even if you do that, what are you actually doing with the data? Nothing, right? Don’t beat yourself up over it because most content marketers just look at reports and numbers and do little to nothing with the data. If you want to figure out how to grow your blog and, more importantly, your revenue from your blog, there are 7 reports that you need to start looking at on a regular basis. Here they are and here is how you use them… Report #1: Cohort AnalysisWhat do you think is easier to accomplish… get new visitors to your blog or getting your visitors to come back? It’s easier to get people to come back to your blog, yet everyone focuses on new visitors. I bet less than 99% of your blog readers turn into customers or revenue, so why not focus on getting those people back and eventually converting them? Before we get into how to get people back to your blog, let’s look at how many people are returning to your blog. Within the Google Analytics navigation, click on “Audience” and then “Cohort Analysis”. Once you land on that report, you’ll see a graph that looks similar to this:
Under the “Cohort Size” drop-down menu, select “by week”. Under “Date Range”, select “Last 12 weeks”. Once the data loads, you’ll see a table that looks something like this:
What this table shows is the percentage of your visitors that come back each week. On the very left it will always show 100%. Then in the columns to the right, you’ll see week 1, week 2, week 3, etc. This shows the percentage of people who come back to your blog each and every week after their first visit. For example, if this week you had 100 people visit your blog and in the week 1 column, it shows 17%. That means of the initial 100 people, 17 came back. Under week 2 if you see 8%, that means of the initial 100 people, 8 people came back in week 2. Naturally, this number will keep getting smaller, but the goal is to get people back as often as possible. That increases trust, social shares, potential people linking to you, and it even increases the odds that the visitor will convert into a customer.
The average blog reader needs to come back 3.15 times before they turn into a customer. That means that you need to retain readers. Just think of it this way: If you get thousands of new people to your blog each and every single day but none of them ever come back, what do you think is going to happen to your sales? Chances are, not much. You need to look at your Cohort Report and continually try to improve the numbers and get people coming back. So the real question is, how do you get people to come back? There are 2 simple ways you can do this:
These 2 strategies are simple and they work. Just look at how many people I continually get back to my blog through emails and push notifications.
Report #2: BenchmarkingEver wonder how you are doing compared to your competition? Sure, you can use tools like Ubersuggest, type in your competitors URL, and see all of the search terms they are generating traffic from.
But what if you want more? Such as knowing what percentage of traffic your competitors are getting from each channel. What’s your bounce rate, average session duration, or even pageviews per channel?
Within Google Analytics navigation, click on “Audiences” then “Benchmarking” then “Channels”. Once you do that, you’ll see a report that looks like the one above. Although you won’t have specific data on a competing URL, Google Analytics will show you how you stack up to everyone else within your industry. I love this report because it shows you where to focus your time. If all of your competitors get way more social traffic or email traffic, it means that’s probably the lowest hanging fruit for you to go after. On the flipside, if you have 10 times more search traffic than your competition, you’ll want to focus your efforts on where you are losing as that is what’ll probably drive your biggest gains. The other reason you’ll want to look at the Benchmarking Report is that marketers tend to focus their efforts on channels that drive the most financial gain. So, if all of your competition is generating the majority of their traffic from a specific channel, you can bet that channel is probably responsible for a good portion of their revenue, which means you should focus on it too. Report #3: Location, location, locationHave you noticed that my blog is available in a handful of languages?
Well, there is a reason for that. I continually look at the location report. To get to it, click on “Audience” then “Geo” and then “Location”.
This report will tell you where the biggest growth opportunities are for your blog. Now with your blog, you’ll naturally see the most popular countries being the ones where their primary language is the one you use on your blog. For example, if you write in English, then countries like the United Kingdom and the United States will be some of your top countries. What I want you to do with this report is look at the countries that are growing in popularity but the majority of their population speak a different language than what you are blogging on. For me, Brazil was one of those countries. Eventually, I translated my content into Portuguese and now Brazil is the second most popular region where I get traffic from. This strategy has helped me get from 1 million visitors a month to over 4 million. If you want step-by-step instructions on how to expand your blog content internationally, follow this guide. Report #4: Assisted conversionsHave you heard marketers talk about how blog readers don’t convert into customers? It’s actually the opposite.
Those visitors may not directly convert into a customer, but over time they will. But hey, if you have a boss or you are spending your own money on content marketing, you’re not going to trust some stats and charts that you can read around the web. Especially if they only talk about long-term returns when you are spending money today. You want hard facts. In other words, if you can’t experience it yourself, you won’t believe it. That’s why I love the Assisted Conversions Report in Google Analytics. In the navigation bar click on “Conversions” then “Multi-Channel Funnels” and then “Assisted Conversions”. It’ll load up a report that looks like this:
This report shows you all of the channels that help drive conversions. They weren’t the final channel in which someone came from but they did visit your blog from one of these channels. In other words, if they didn’t visit or even find your blog from one of these sources, they may not have converted at all. Now when your boss asks you if content marketing is worth it, you can show the Assisted Conversions Report to show how much revenue your blog helps drive. The other beautiful part about this report is that it tells you where to focus your marketing efforts. You want to focus your efforts on all channels that drive conversions, both first and last touch. Report #5: Users flowWhat’s the number one action you want your blog readers to take? I learned this concept from Facebook. One of the ways they grew so fast is they figured out the most important action that they want people to take and then they focused most of their efforts on that. For you, it could be someone buying a product. For me, it’s collecting a lead and that starts with a URL. But I found that people interact with my blog differently based on the country they are coming from. In other words, if I show the same page to a United States visitor and from someone in India or even the United Kingdom, they interact differently. How did I figure that out? I ran some heatmap tests, but, beyond that, I used the Users Flow Report in Google Analytics.
In your navigation click on “Audience” and then “Users Flow”. Within the report, it will break down how people from each country interact with your blog and the flow they take. I then used it to adjust certain pages on my blog. For example, here is the homepage that people in the United States see:
And here is the homepage that people from the United Kingdom see:
The United Kingdom homepage is much shorter and doesn’t contain as much content and that’s helped me improve my conversions there. And of course, in the United States, my audience prefers something else, hence the homepages are different. The Users Flow Report is a great way to see how you should adjust your site based on each geographical region. Report #6: Device overlapBlog content can be read anywhere and on any device. From desktop devices to tablets to even mobile phones. The way you know you have a loyal audience isn’t just by seeing how many of your readers continually come back, but how often are they reading your blog from multiple devices. For example, you ideally want people to read your blog from their iPhone and laptop. The more ways you can get people to consume your content, the stronger brand loyalty you’ll build, which will increase conversion. Within the navigation, click on “Audience” then “Cross Device” and then “Device Overlap”.
I’m in the B2B sector so my mobile traffic isn’t as high as most industries but it is climbing over time. And what I’ve been doing is continually improving my mobile load times as well as my mobile experience to improve my adoption rates. I’m also working on a mobile app. By doing all of these things, people can consume content from NeilPatel.com anywhere, which builds stickiness, brand loyalty, and then causes more assisted conversions. A good rule of thumb is if you can get the overlap to be over 6%, you’ll have a very sticky audience that is much easier to convert. That’s at least what I can see with all of the Google Analytics accounts I have access to. Report #7: User ExplorerTo really understand what makes your blog readers tick, you need to get inside their mind and figure out what their goals are and how you can help them achieve each of those goals. A great way to do this is through the User Explorer Report. Click on “Audience” and then “User Explorer”. You’ll see a screen that looks like this:
This shows you every user who visits your site and what they did. You can click on a client id to drill down and see what actions each user performed on your blog.
From there, you can click on a time to see exactly what they did each time they visited:
What I like to do with this report is to see how the most popular users engage with my blog. What are they reading? What pages are they spending the majority of their time on? What makes them continually come back? How did they first learn about my blog? By comparing the most popular blog readers with the least popular, I am typically able to find patterns. For example, my most loyal blog readers typically find my site through organic traffic and then subscribe to my email list. Then they keep coming back, but the key is to get them to opt into my email list. That’s why I am so aggressive with my email captures. I know some people don’t like it, but I’ve found it to work well. So I focus a lot of my efforts on building up my organic traffic over referral traffic and then collecting emails. Look at the patterns that get your most popular users to keep coming back and then adjust your blog flow so that you can create that pattern more often. ConclusionYes, you should look at your visitor count. But staring at that number doesn’t do much. The 7 reports I describe above, on the other hand, will help you boost your brand loyalty, your repeat visits, and your revenue. I know it can be overwhelming, so that’s why I tried to keep it to just 7 reports. And if you can continually improve your numbers in each of those reports, your blog will continually grow and eventually thrive. So what Google Analytics reports do you look at on a regular basis? The post 7 Google Analytics Reports That Show How Your Blog is Really Performing appeared first on Neil Patel. The post 7 Google Analytics Reports That Show How Your Blog is Really Performing appeared first on Projabez Media – Digital Marketing Agency. from https://projabezmediadigitalmarketingseoagency.wordpress.com/2019/07/19/7-google-analytics-reports-that-show-how-your-blog-is-really-performing/ from https://digitalmarketingagencymiltonkeynes.blogspot.com/2019/07/7-google-analytics-reports-that-show.html from https://agencymilton.tumblr.com/post/186402518799 from https://localseomarketingmiltonkeynes.blogspot.com/2019/07/7-google-analytics-reports-that-show.html from https://localseomarket.tumblr.com/post/186403675902 from https://freddurbin.blogspot.com/2019/07/7-google-analytics-reports-that-show.html
The social web is huge. From Facebook to Pinterest, they all command billions of eyeballs per year. Which, of course, makes these channels too big to ignore. In other words, you have no choice but to participate in them or else you’ll miss out on traffic and revenue. But, how much time and money should you devote to each social network? Which ones produce the best ROI? How much are 100 social media followers really worth? To answer these questions and more, I polled 483 companies who are all leveraging Facebook, YouTube, Instagram, Twitter, LinkedIn, and Pinterest. Each company has been participating in all these social networks for at least 3 years and they have at least 100 social media followers on each platform. Of the 483 companies, 159 of them were in the B2B space and 324 were B2C companies. And their revenues varied from $10,000 a year to $250,000,000. Now before we dive into the data, keep in mind all of the stats are broken down based on 100 social followers. For example, if we looked at traffic, we looked at how many visitors they generate per 100 followers. And for the purpose of this blog post, we will focus only on organic social media traffic. So, let’s dive into what we learned: Social media traffic over timeCompared to when each social network originally came out, it’s become much harder to generate organic traffic from each of them. You can still generate organic visits, but of course, reach has died down. But how much has it died down?
As you can see, it has drastically decreased. In 2015, you could generate a bit more than 3 visitors a month from the social web for every 100 followers you had, and now it’s dropped down to roughly 2 visitors per month. I know that data isn’t shocking, but think of it this way, that’s a 38.6% drop in organic social media traffic. And based on the chart, there are no signs of recovery. But what about traffic by social network?Sure, organic social media traffic might be dying as each network wants you to advertise, but which networks drive the most traffic per 100 followers? If you had to take a guess, which one do you think it would be?
It’s definitely not a social network owned by Facebook. Both Facebook and Instagram drive the least amount of visitors per 100 followers. Instagram isn’t much of a shocker, though, as you can only drive traffic through bio links and asking people to swipe up in stories. But what was surprising is the amount of traffic Pinterest drives. Pinterest was the best performer, followed by LinkedIn and then YouTube. Here’s the thing to note about YouTube… although it drives a decent amount of visitors per 100 subscribers, most people using YouTube don’t experience much (if any) traffic because they don’t link out to their site within their videos. You can use YouTube annotations to do this. Does posting more often mean more social traffic?The first chart shows that organic social traffic is slowly dying down, but how about if you increase your posting frequency? That should increase your organic social media traffic, right?
In general, posting more often does lead to more traffic. But after 8 monthly posts on each social network, the data shows you’ll see diminishing returns. Why you may ask? The way most social media algorithms work is that the more people engage with your content, the more of them will see your content as you post it. So, your goal should be to only post content people love and want to engage with. The moment you start posting mediocre content, it hurts your overall traffic numbers because that means fewer people in the future will see your new content no matter how amazing it is. Speaking of engagement, which social networks tend to have the most engaged users? Engagement by social networkI was shocked by the engagement stats because I assumed that Pinterest would have won in this battle as they are driving the most traffic per 100 followers to websites. But I was wrong.
Pinterest did perform really well, but LinkedIn won. Instagram also did extremely well, which I wasn’t shocked by as most of the people I know who use it do so as a “personal” social network instead of leveraging it for work. That’s why the engagement is so high on Instagram. One thing to note is that posts not containing a link, such as images or videos, tend to get the most engagement. This is also because social sites tend to promote content that keeps people on their social sites as opposed to driving their visitors off to your site. Which social networks prefer videos?If you aren’t producing videos, you should definitely consider starting. Even though videos don’t rank well on Google, they are the future. It’s why I create more video content each week than text-based content. With video, there are 2 main types of videos… one that you just upload and ones that are live. Let’s see how the different video types stack up against each other.
When you look at the chart above, it’s easy to say that Instagram produces the best results for videos. Then come LinkedIn and YouTube. But there is something that you have to keep in mind… Instagram auto-plays videos while YouTube is much pickier about what they count as a “video view.” None-the-less, if you’re going to create video content, you should post it on all of the social networks out there, but I would first focus the majority of your efforts on Instagram, LinkedIn, and YouTube. YouTube won’t provide amazing numbers in the first 24 hours of uploading a video, but through YouTube SEO, you can continually get views while you won’t see that happen on any of the other social networks. For live videos, the results are similar in which Instagram and YouTube lead the pack.
But what is interesting is that live videos don’t generate as many viewers as just posting and scheduling them. When we dug into why the main reason wasn’t that social sites don’t want live content, it’s that with non-live videos, businesses spend more time leveraging keyword research and optimizing their videos for the maximum amount of views. While on the flip side it is a bit harder to do that with live videos. If you want to get the most views from your videos, use tools like Ubersuggest to see what keywords are popular. Putting keywords in your title and descriptions isn’t enough, though. Social media sites are able to decipher the sound to see what your video is really about. Now let’s get into the best part… conversions and sales. The money is in the listHave you heard the saying, the money is in the list? If you aren’t collecting emails, you should start right away. Because once you have an email list, you can always market to people on your list and convince them to buy your products or services.
LinkedIn has the best conversion rates from a visitor to an email subscriber. Pinterest and YouTube also perform really well. You may think that most of the people on LinkedIn only care about B2B but that is wrong. Remember everyone on LinkedIn is also a consumer. They buy everyday products just like you and me. What was interesting with the email collection numbers is that the majority of your social media followers won’t ever convert into email subscribers. But as you share and post content on the social web, the followers of your followers may also see your content, which then increases the likelihood of getting more traffic and email subscribers. What about revenue?Whether you love or hate social sites, they do drive revenue. And no you don’t have to spend money on ads to generate revenue. Ads do help, of course, but here is the percentage of revenue that each business generated from organic social media traffic.
It’s been declining over the years, but the numbers are starting to flatten out. The decline isn’t just related to social media algorithms becoming tougher, though. It’s that businesses are also diversifying their marketing approach. They are taking an omnichannel approach which means they leverage more channels. Because of that, each one also makes up a smaller portion of their revenue. ConclusionSocial media is still strong and kicking. You may only be able to generate 2 visitors a month for every 100 followers you have, but that scales as you grow your social following on every network. Plus, the brand effect you can get by doing things like uploading videos will also help significantly. Now before we wrap things up, I thought it would be interesting to see what percentage of social media traffic is generated from organic efforts versus paid:
There is a huge trend of companies spending more and more money on social media, which aligns with the stock price and financials of companies like Facebook, Pinterest, and Twitter. None-the-less, don’t be discouraged by your social media traffic dwindling down. If you get a bit creative and follow this, you can spike your numbers. So, what are your social followers worth to you? The post New Study: What 100 Social Media Followers Are Really Worth appeared first on Neil Patel. The post New Study: What 100 Social Media Followers Are Really Worth appeared first on Projabez Media – Digital Marketing Agency. From https://projabez.com/2019/07/19/new-study-what-100-social-media-followers-are-really-worth/ from https://projabezmediadigitalmarketingseoagency.wordpress.com/2019/07/19/new-study-what-100-social-media-followers-are-really-worth/ from https://digitalmarketingagencymiltonkeynes.blogspot.com/2019/07/new-study-what-100-social-media.html from https://agencymilton.tumblr.com/post/186402518609 from https://localseomarketingmiltonkeynes.blogspot.com/2019/07/new-study-what-100-social-media.html from https://localseomarket.tumblr.com/post/186403675797 from https://freddurbin.blogspot.com/2019/07/new-study-what-100-social-media.html
What percentage of your search traffic is driven by your top 10 pages? Chances are, it’s a large portion. Just look at the screenshot below. You’ll see that my top 10 pages drive 28.7% of my search traffic.
That may not seem like a high number, but I have 5,441 blog posts. In other words, 0.1% of my pages make up 28.7% of my search traffic. Typically, with smaller sites, the percentages are much higher in which the top 10 pages make up the majority of their search traffic. So, what does that tell you? You should just focus on your top 10 pages and ignore the rest? Or, even worse, just focus on cranking out more new content? Quality over quantityI used to have the philosophy of “more is better.” I was cranking out dozens of articles each week. At one point, I was publishing 2 articles a day on this blog. And, over time, my traffic grew, but not by much. I was spending all of this time writing and realized that the majority of the content I was publishing never ranked. So, what did I do? I started focusing on my old, outdated content to boost my traffic. Just think of it this way: Every week I publish one new piece of content, but my team, on average, is updating 23 older articles. When I used to write more frequently, my top 10 pages made up 33% of my search traffic.
Since then, I have increased my search traffic by 107% and reduced my reliance on my top 10 pages by 13%. So how did I do this? Well, as I mentioned, I have my team focus on updating my old, outdated content while I focus on creating new content. Here’s exactly what I have my team implement, step by step. Look for pages that were once lovedWith Google Search Console, you have access to data for a much longer period of time. You can go back up to 16 months. So, I want you to compare this month’s results during the same period as last year. You can do this by clicking on “date” and then “compare.” Next, select your older date period first (should be roughly from a year ago) and then select today’s date period.
I’ve been doing this for a while, so I selected an older date range so you can see a better set of data before my team really focused on updating old content. You should then see a report that looks something like this:
What you’ll want to do is look for articles that used to get a ton of traffic and have less now. From the screenshot above, you can see that my article on Instagram used to perform really well, but no so much anymore. Keep in mind that I selected the older date range first. I did this to see which of my old pieces of content used to rank well so I can see if any of them have dropped over the last 12 months. This will show you old content that Google used to love, but no longer does. Now, let’s find content that Google never loved. Look for pages Google never lovedLog back into Search Console and look for pages that have a high impression count but never got any real clicks. The easiest way to find these pages is to set your date range to the last 28 days and look at each page’s metrics from an impression, click, and CTR perspective. Sort the CTR column in ascending order (lowest percentage at the top, the highest percentage at the bottom).
Typically, the pages at the top of that list have the most potential. It means that Google is ranking you but you just aren’t getting too many clicks. It usually isn’t just related to your title tag and meta description. It typically has to do with the content on the page. Now it’s time to create a list of pages that have the greatest potential. It’s time to prioritizeTypically, the pages that have the most potential are the ones that used to rank but no longer rank. Google used to rank and like them, which means if you give those pages a little tender loving care, you can easily get them loved by Google again. The second group of pages that have potential, but not as much as the first, are the ones with a high impression count but an extremely low CTR. These pages are harder to fix because they never really performed that well. How to update your old contentNow that you have a list of pages to fix so you can boost your search engine rankings, I want you to log in to Google Search Console, find that article, click on it, and then click on “queries.”
For the keywords that don’t rank in the top 5 or have a high impression volume, I want you to go to your ranking article and see if the article is relevant for that term. If not, adjust the article to at least include that term and cover that topic. For the terms you already rank for in the top 5 spots, head over to Ubersuggest and type in those keywords and click on the keyword ideas report.
You’ll then see a report with all of the long-tail variations of that keyword. If you adjust the article and include any of the long-tail phrases Ubersuggest gives you, you’ll see quick traffic gains. In other words, if you already rank for the head term, it’s not hard to rank for the long-tail variation of it as well. In addition to including the right keywords, you’ll want to update the post. Make sure all of the information is relevant, the pictures are up to date, and if you could include any multimedia (like embedding relevant YouTube videos) you’ll be able to increase the time on site of your visitors. Finally, when updating your content, make sure your article is more thorough than all of the other sites that rank for the terms you are trying to rank for. Remember that keyword ideas report I had you check out on Ubersuggest? On the right-hand side of that report, it shows you all of the sites that rank for that keyword.
You can quickly see who’s currently ranking in each country, visit their web page, and make sure you create something better. User metricsUser behavior is one of the biggest factors with Google’s algorithm. Once you update your old content, you’ll want to optimize for user signals as that’ll help boost rankings. A great example of user metrics is optimizing your title tags and meta description. For example, if everyone searched a keyword on Google and clicked on the second result instead of the first, it tells Google that the second result is more relevant and that it should be ranking in the first spot instead of the second. And Google eventually would make that change. If you can use persuasive copy and convince people to click on your search listing instead of the competition, eventually your rankings will climb. And you can do so by following these 2 articles:
Over the years, I’ve done a lot of title tag and meta description tests and I’ve also found that these keywords help increase clicks:
You can also use tools like Clickflow to A/B test your meta tags. Don’t forget to promote (again)Now that your content is up to date and you’ve optimized your meta tags for clicks, it’s time for you to promote your content. I know what you are thinking… why would you promote old content, right? Well, technically it isn’t old anymore. First of all, you should update the published date or last updated date within your WordPress.
That way search engines know your content is changed, more relevant, and up to date. Secondly, you need to promote the article. It’s new now, so why wouldn’t you share it with the world? The simplest thing you can do is share it on the social web. I typically share my content on Facebook, Twitter, and LinkedIn… but you can pick whatever social profiles you have. Although Google doesn’t really look at social signals, Bing does. Plus, some people who visit your page from the social web may decide to link to your article, which does help rankings. And if you want to go above and beyond, check out Meet Edgar. It’s what I use to continually schedule my old content to be promoted on the social web. That way I don’t have to manually do it or set reminders. In addition to social shares, you should consider sending out a text-based email blast to your audience promoting your content. It’s a great way to get a quick boost of traffic and breathe life into your old content. Here’s an example of a text-based email blast that I send so you can copy my format.
As you can see, simple text-based emails are generating 30% open rates and 6% click rates for me. Not too shabby. You can also use tools like Subscribers to send out a push notification. Every time I update a post I send out a push. Look at my stats… I can easily generate an extra 7,000 visitors from a single push.
And don’t forget to build linksThe last step you want to leverage is link building. You can use Backlinks to see who is linking to competing articles:
All you have to do is put in a competing URL and select “URL” from the drop-down menu and you’ll see every site that links to that page. From there, you’ll want to reach out to each site and ask them to link to you. The easiest way to do this is to leverage the skyscraper technique and the steps in this article. ConclusionOnce you hit the 150 mark in the number of pages on your site, you should consider focusing the majority of your time to updating old content instead of creating new content. If you have over 1,000 pages, you should definitely spend 80-plus percent of your time updating old content instead of writing new content. The key to ranking your old, outdated content is to first focus on the content that used to rank but doesn’t anymore. Once you fix those pages, you should see results within a month or two. From there, you can then focus on pages that have a high impression count but a low click count. So, are you going to focus your time on ranking your old content or creating new content? The post How to Rank Your Old, Outdated Content appeared first on Neil Patel. The post How to Rank Your Old, Outdated Content appeared first on Projabez Media – Digital Marketing Agency. From https://projabez.com/2019/07/19/how-to-rank-your-old-outdated-content/ from https://projabezmediadigitalmarketingseoagency.wordpress.com/2019/07/19/how-to-rank-your-old-outdated-content/ from https://digitalmarketingagencymiltonkeynes.blogspot.com/2019/07/how-to-rank-your-old-outdated-content.html from https://agencymilton.tumblr.com/post/186402518394 from https://localseomarketingmiltonkeynes.blogspot.com/2019/07/how-to-rank-your-old-outdated-content.html from https://localseomarket.tumblr.com/post/186403675642 from https://freddurbin.blogspot.com/2019/07/how-to-rank-your-old-outdated-content.html Welcome to WordPress. This is your first post. Edit or delete it, then start writing! From https://projabez.com/2019/07/19/hello-world/ from https://projabezmediadigitalmarketingseoagency.wordpress.com/2019/07/19/hello-world/ from https://digitalmarketingagencymiltonkeynes.blogspot.com/2019/07/hello-world.html from https://agencymilton.tumblr.com/post/186400310689 from https://localseomarketingmiltonkeynes.blogspot.com/2019/07/hello-world.html from https://localseomarket.tumblr.com/post/186401485302 from https://freddurbin.blogspot.com/2019/07/hello-world.html There’s a formula to SEO and as long as you follow it, you’ll get rankings. So, what’s this formula? Well, you write amazing content, optimize your code, create a great user experience, and you mix in some backlinks. Sounds simple, right? Well, the formula isn’t too complicated, but it does require hard work and patience. […] The post How to Outrank Big Companies When You Have No SEO Budget appeared first on Projabez Media. From https://projabez.com/how-to-outrank-big-companies-when-you-have-no-seo-budget/ from https://projabezmediadigitalmarketingseoagency.wordpress.com/2019/05/18/how-to-outrank-big-companies-when-you-have-no-seo-budget-2/ from https://digitalmarketingagencymiltonkeynes.blogspot.com/2019/05/how-to-outrank-big-companies-when-you_18.html from https://agencymilton.tumblr.com/post/184964576764 from https://localseomarketingmiltonkeynes.blogspot.com/2019/05/how-to-outrank-big-companies-when-you_18.html from https://localseomarket.tumblr.com/post/184966880767 from https://freddurbin.blogspot.com/2019/05/how-to-outrank-big-companies-when-you_18.html |

Fred DurbinEarth is the third planet from the Sun and the only astronomical object known to harbor life. According to radiometric dating and other sources of evidence, Earth formed over 4.5 billion years ago. Earth's gravity interacts with other objects in space, especially the Sun and the Moon, Earth's only natural satellite. Earth revolves around the Sun in 365.26 days, a period known as an Earth year. During this time, Earth rotates about its axis about 366.26 times. ArchivesNo Archives Categories |


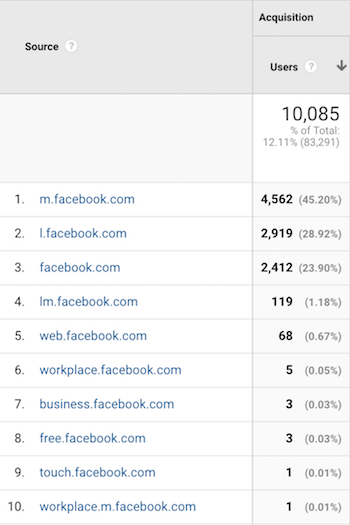
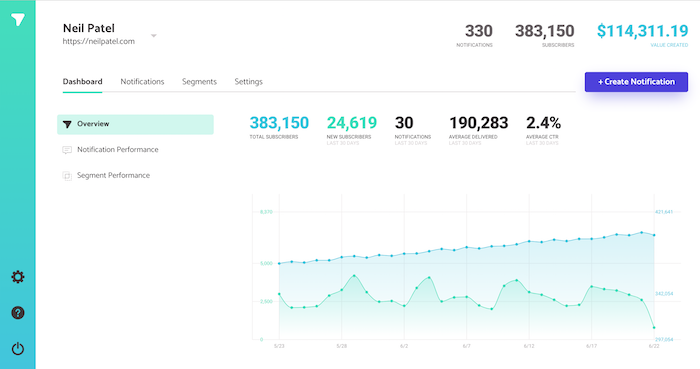

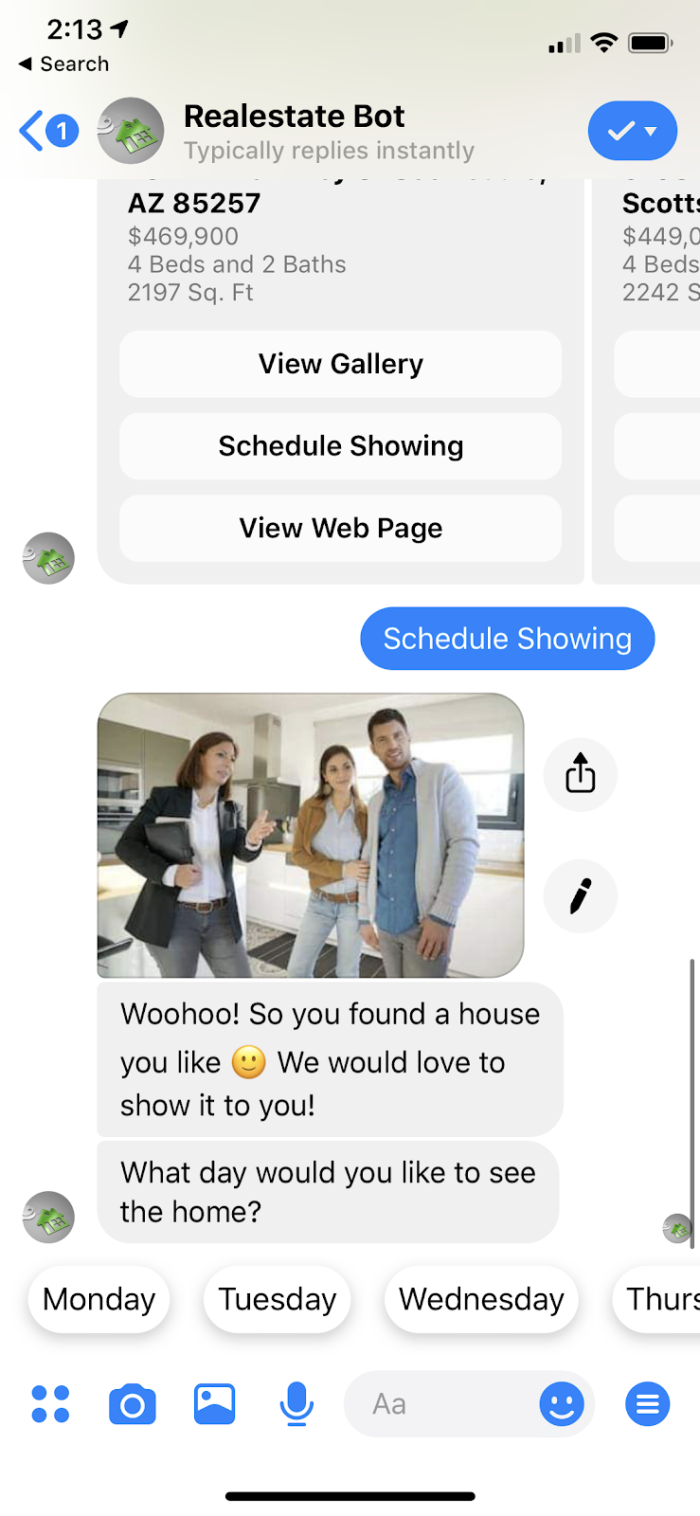
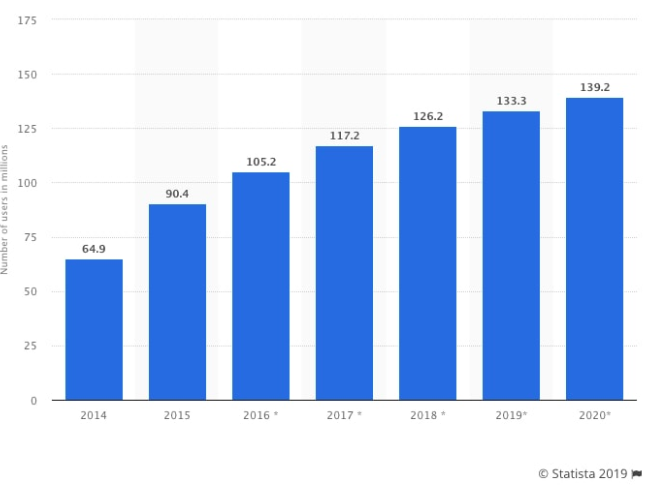

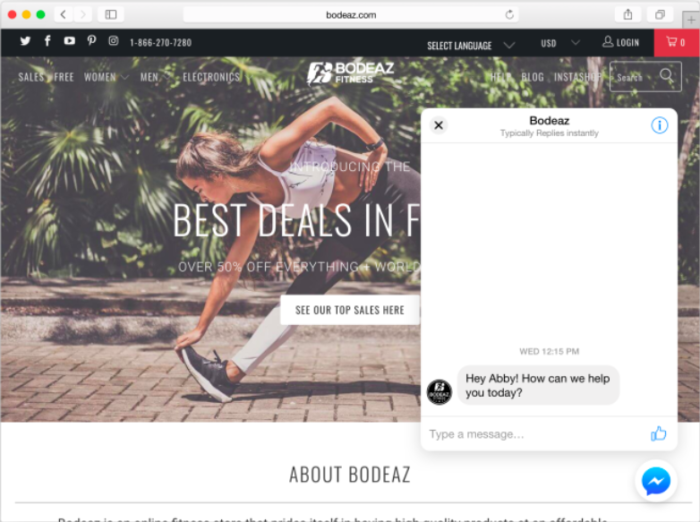
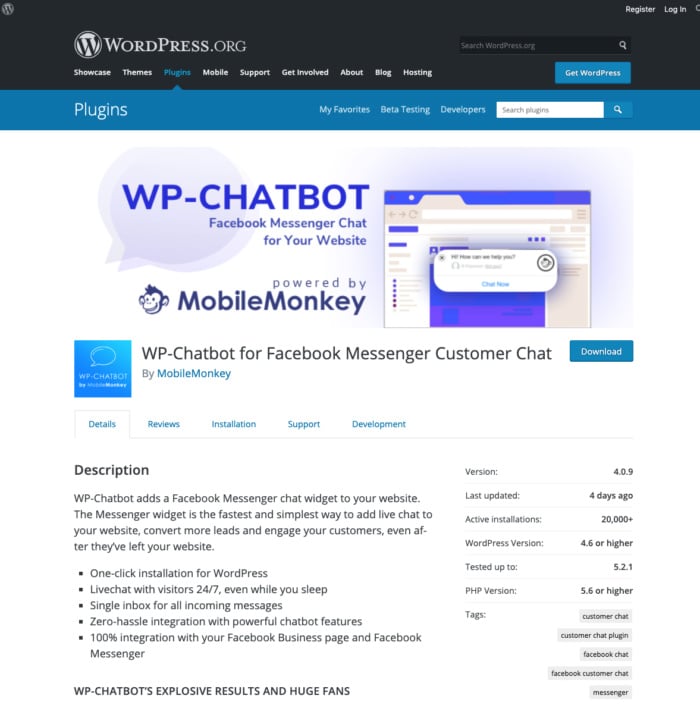
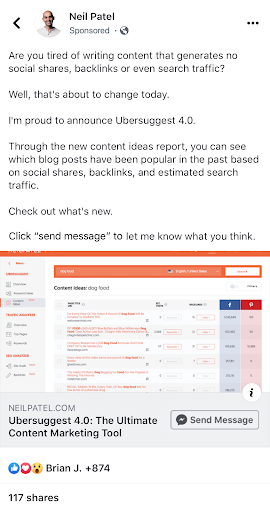
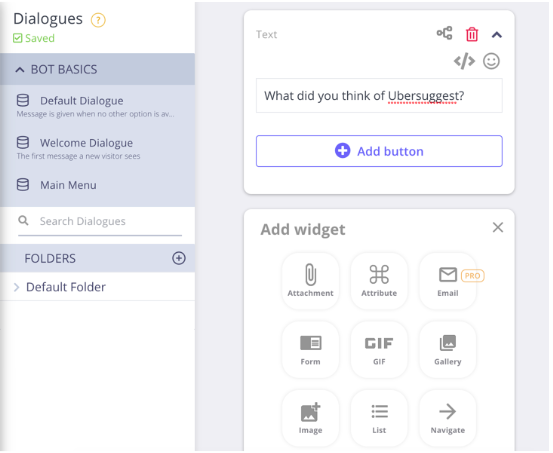
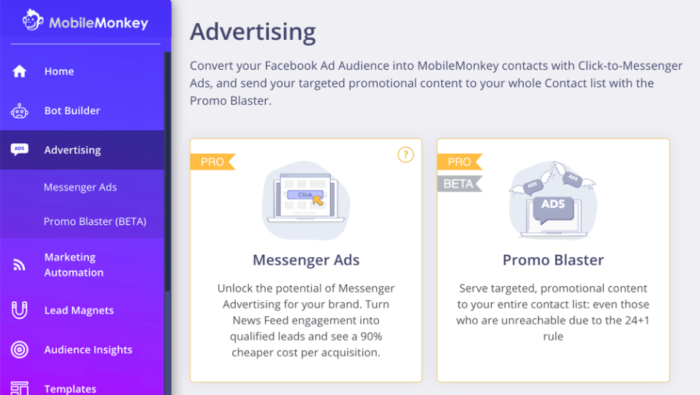
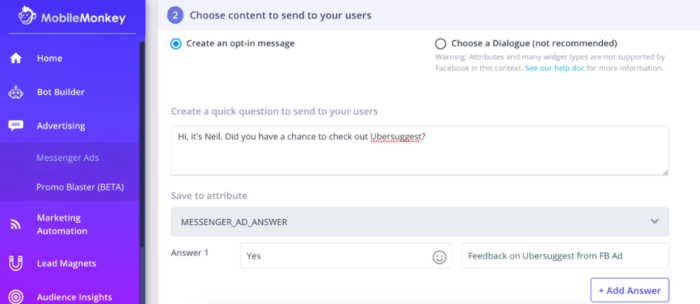
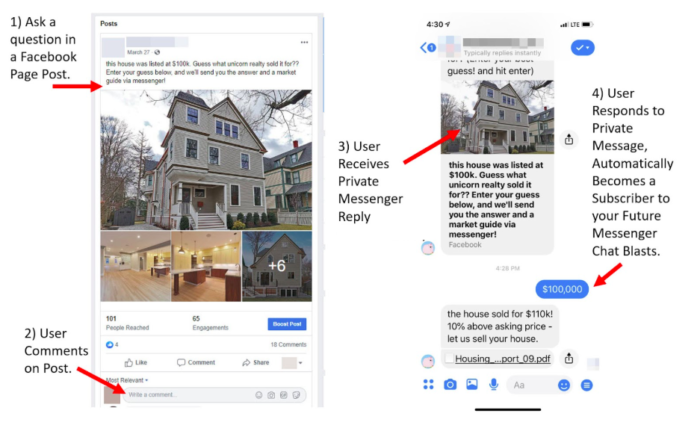

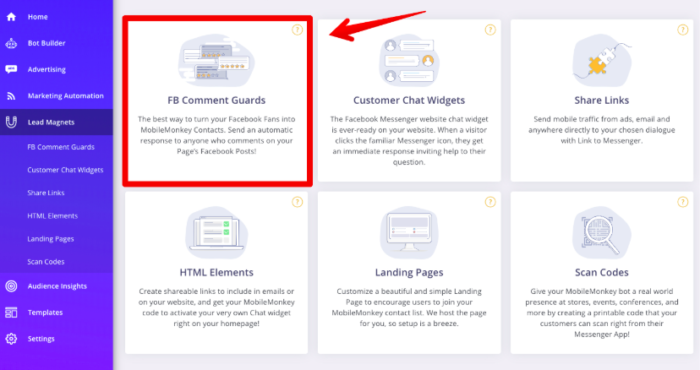

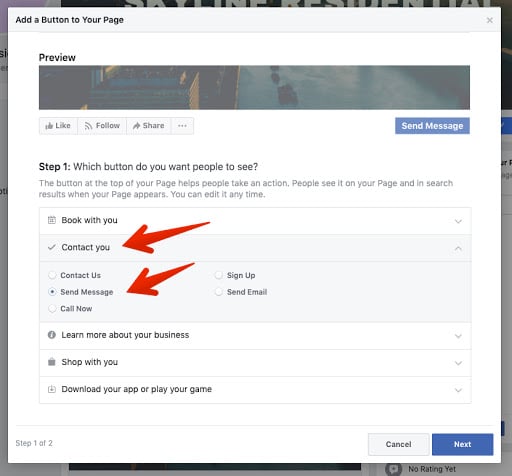
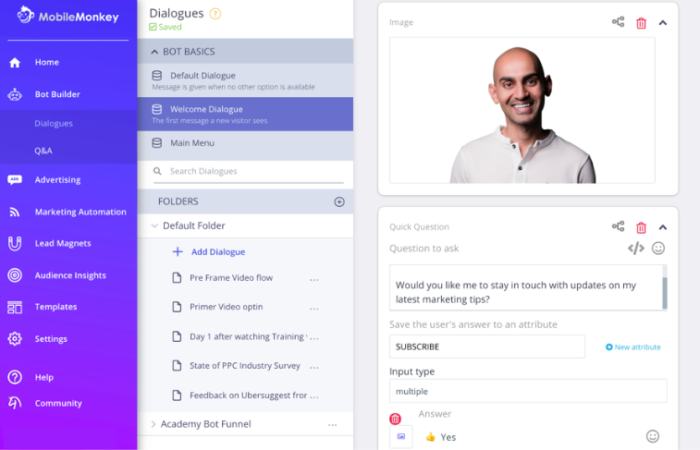
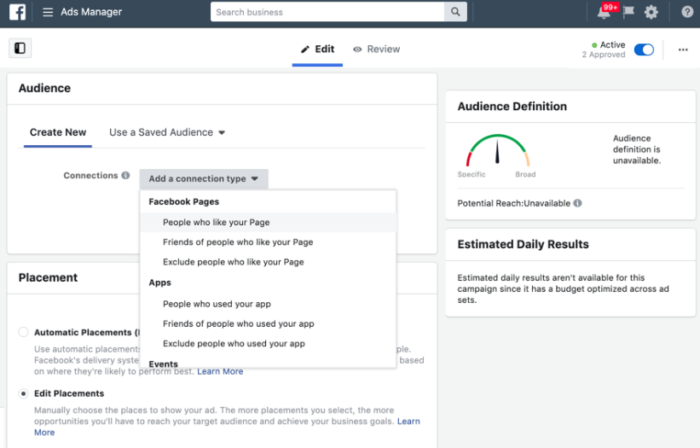

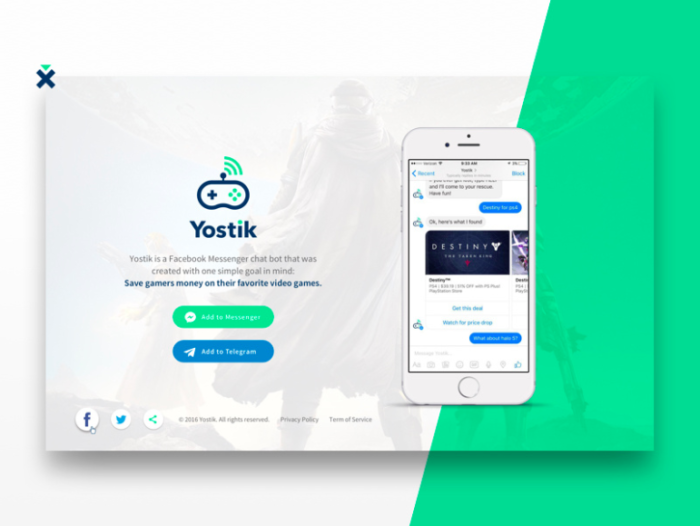
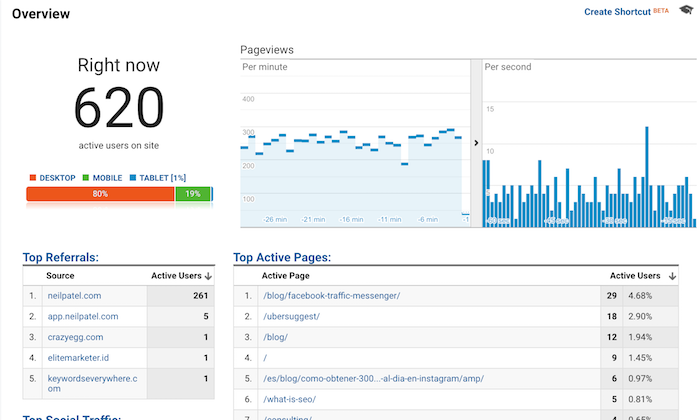

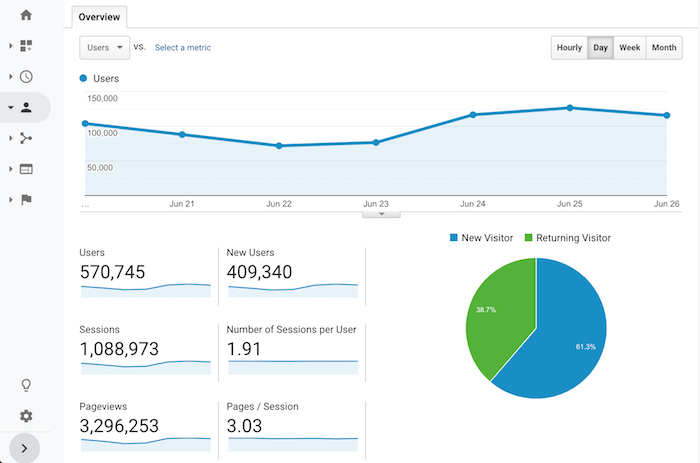
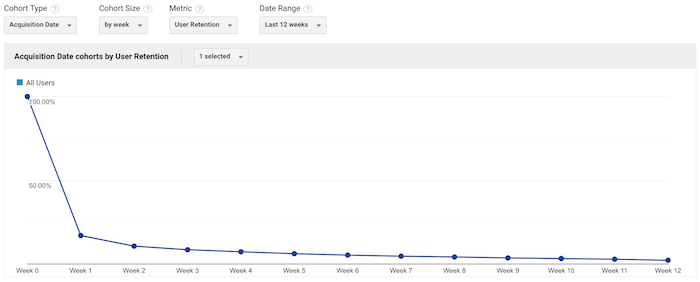
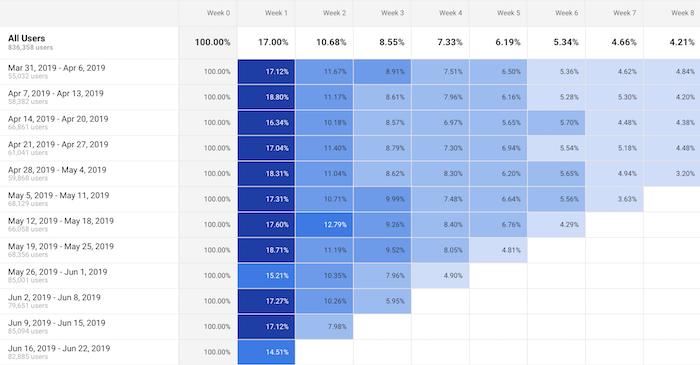
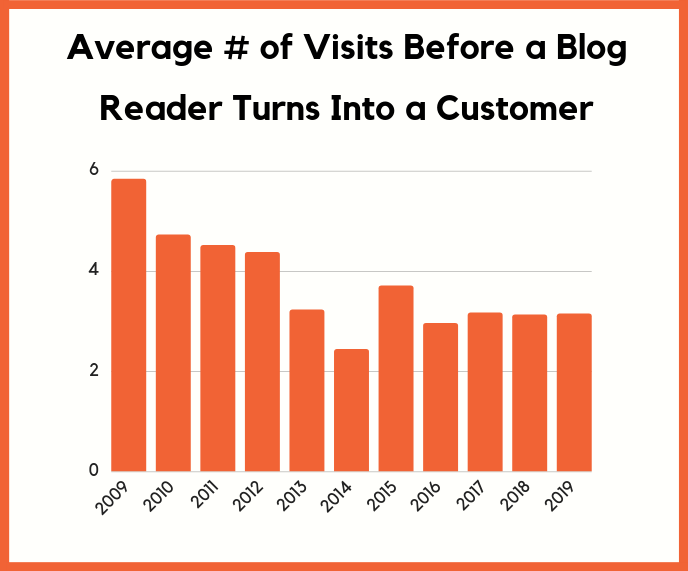
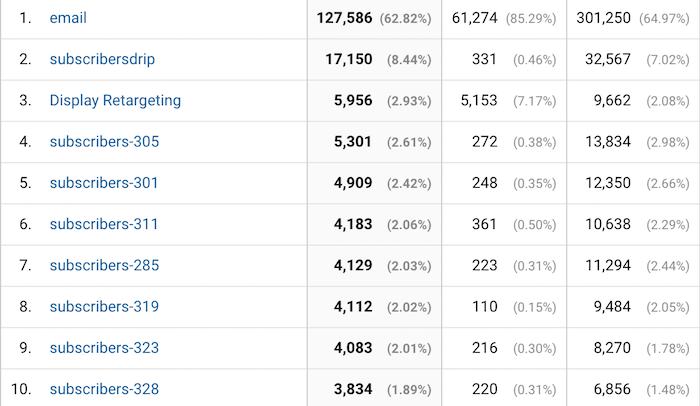
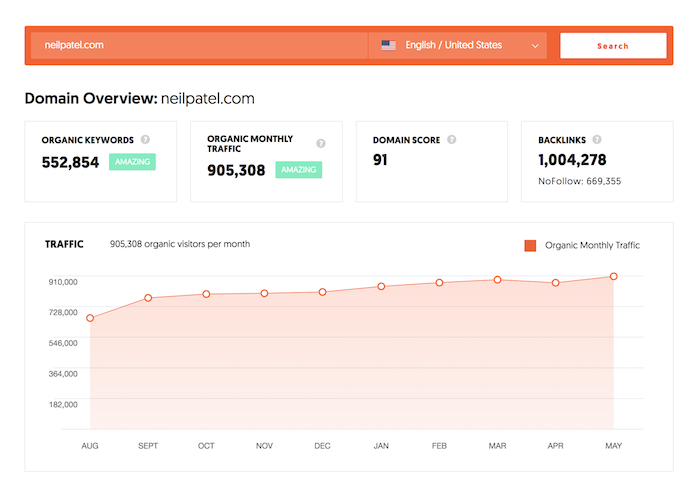
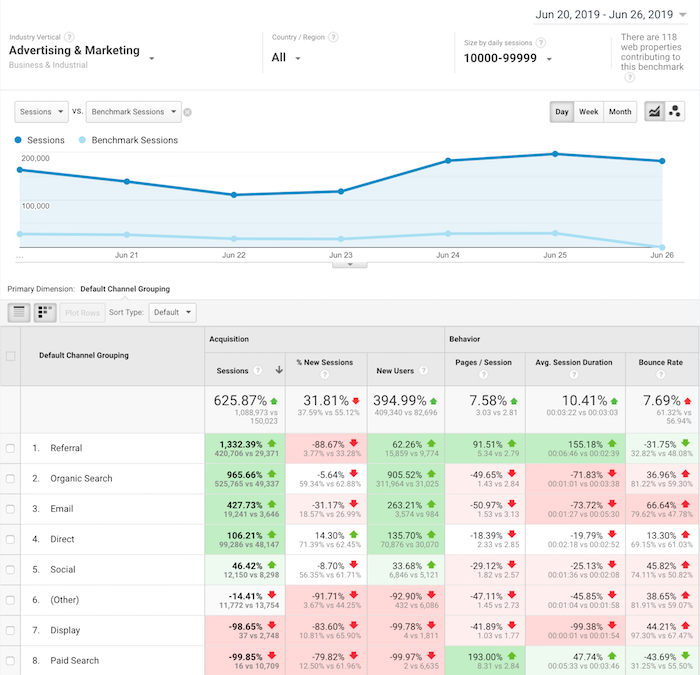
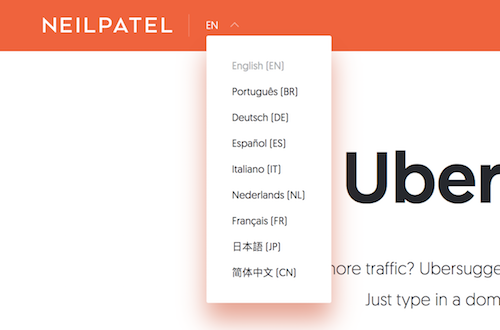
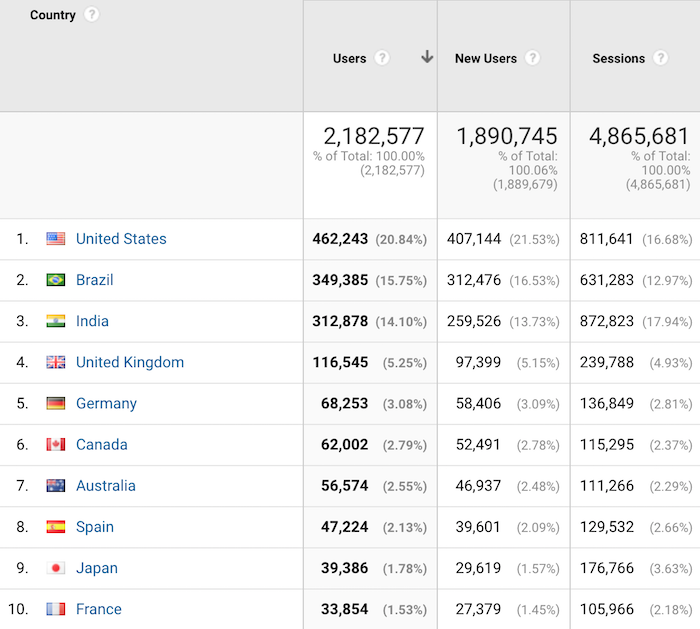
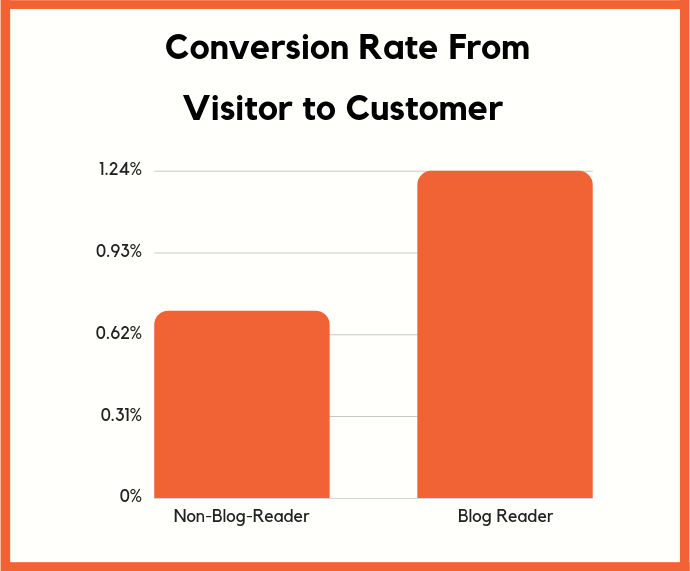
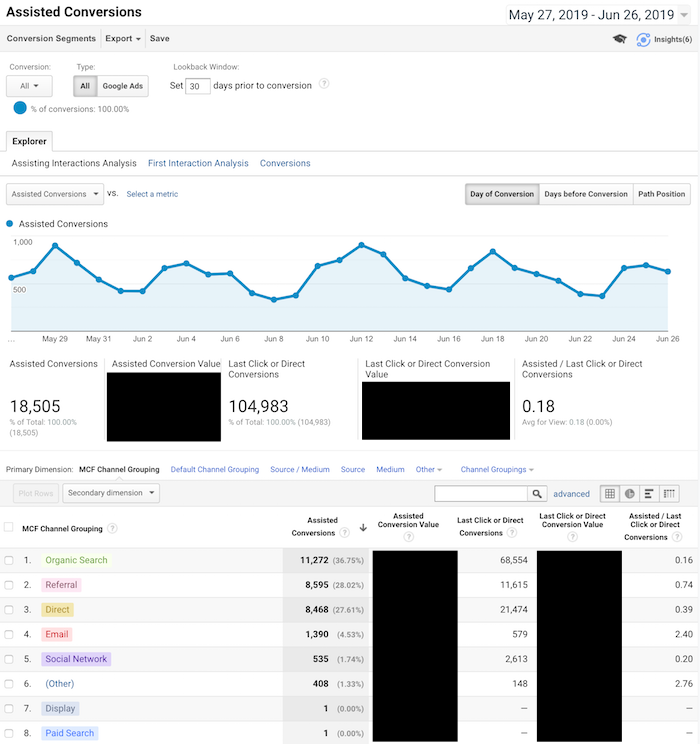
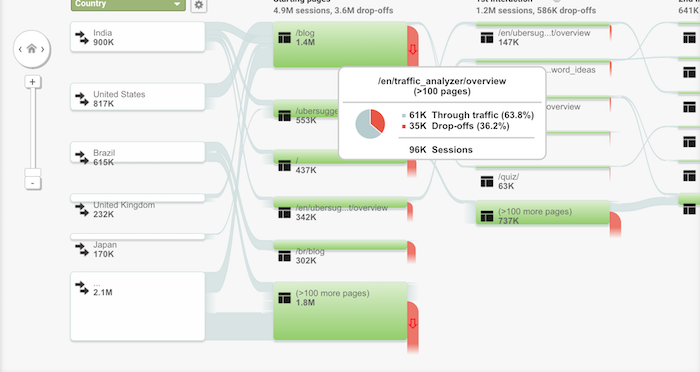
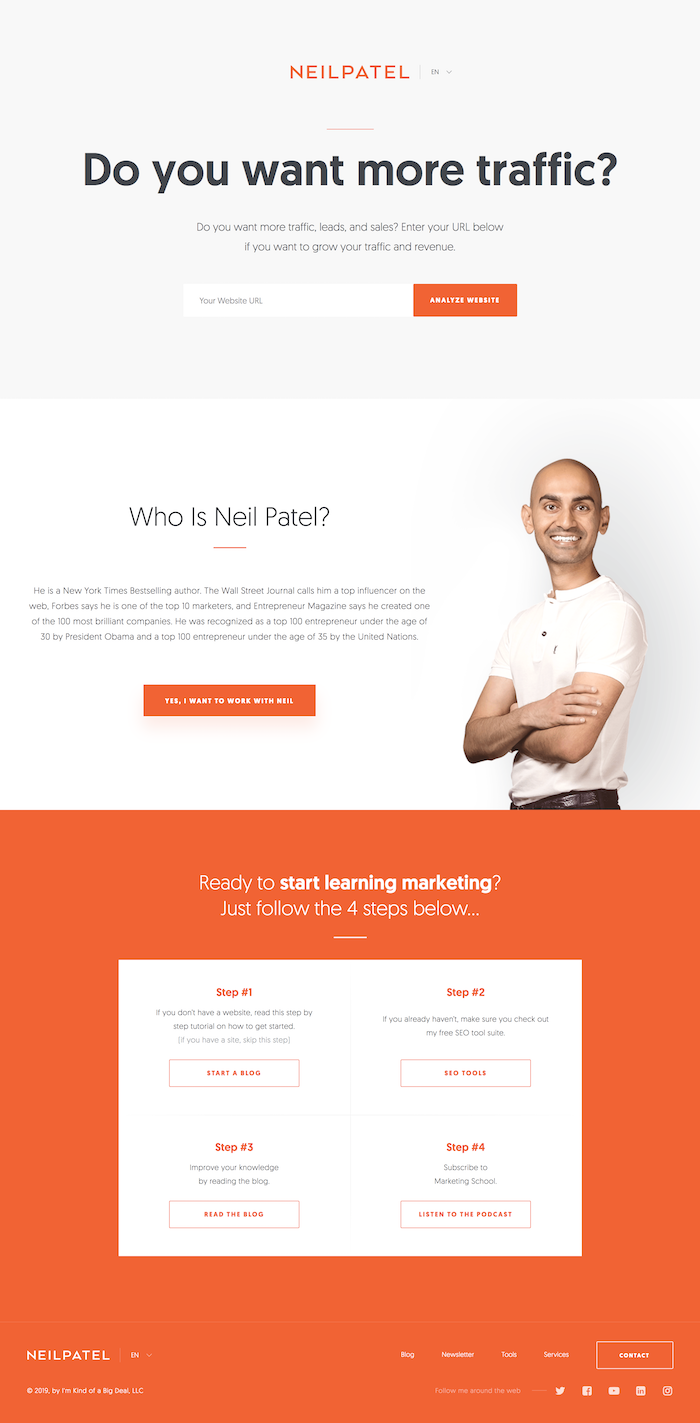
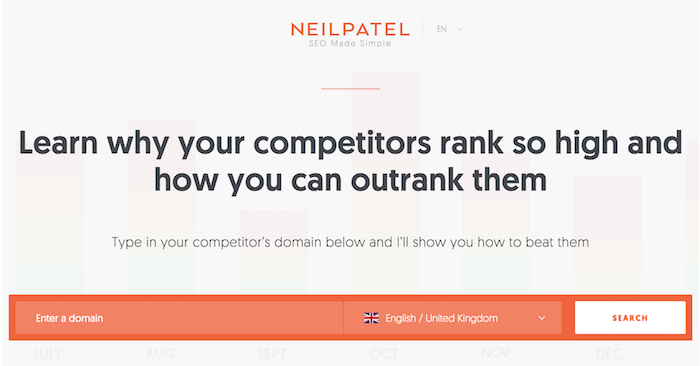
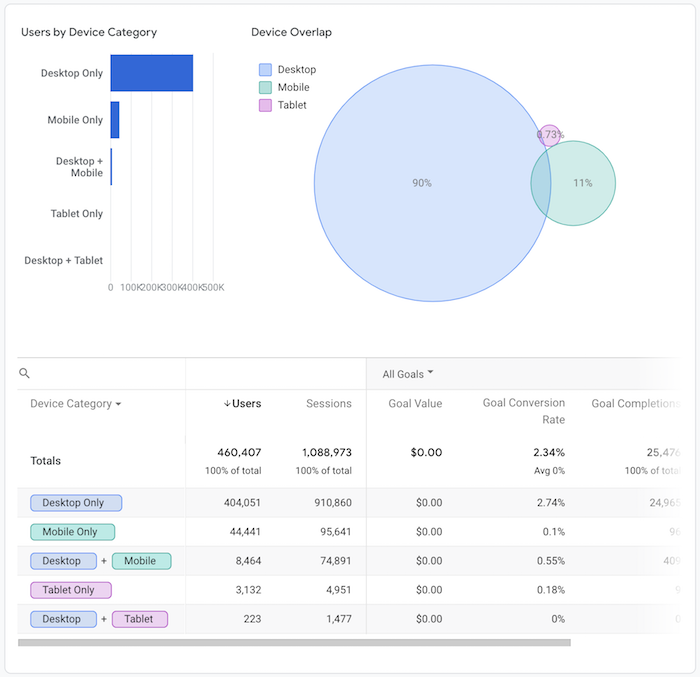
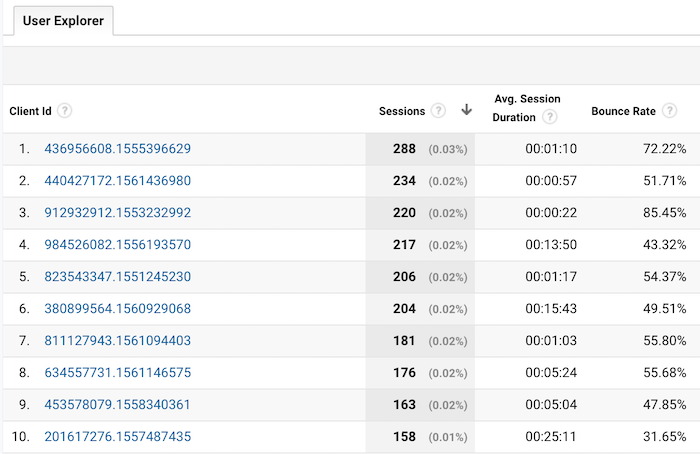
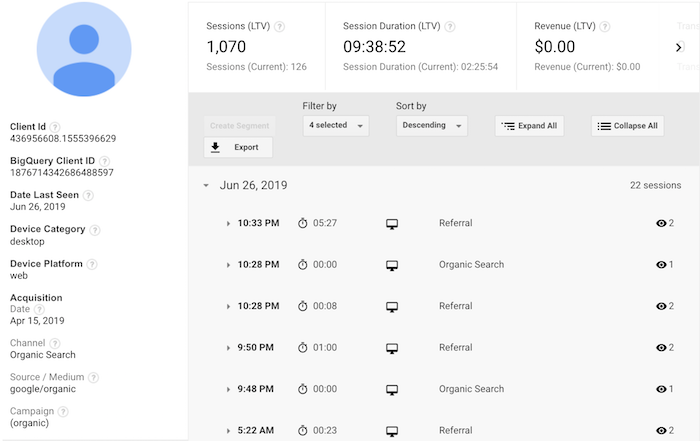
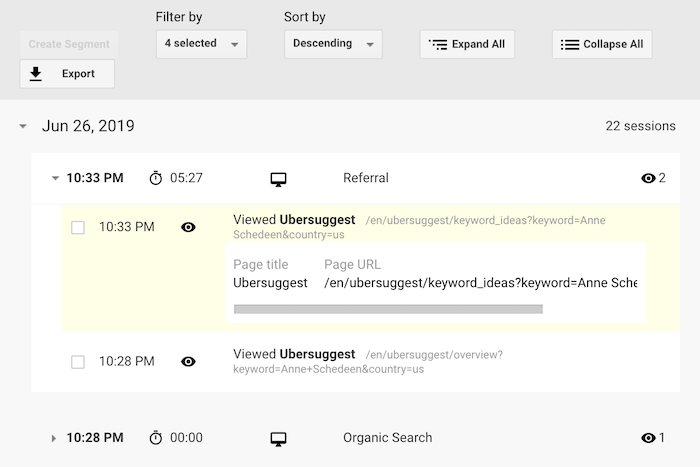
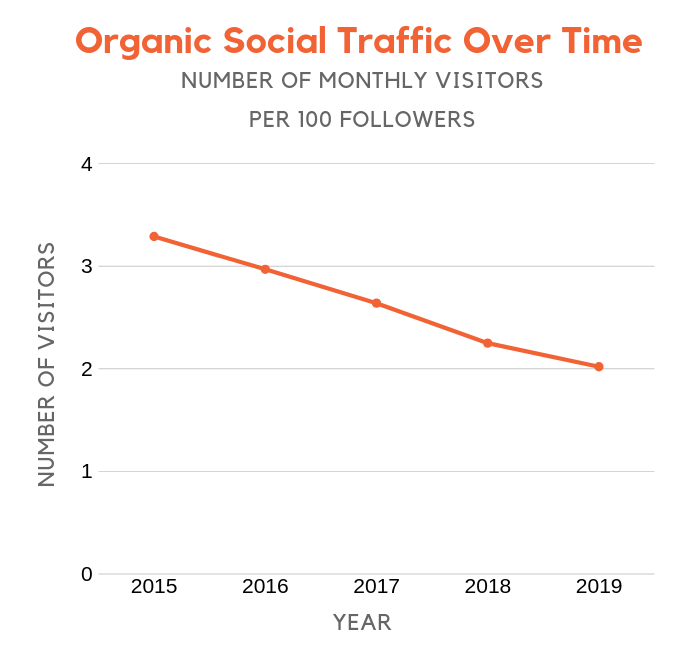
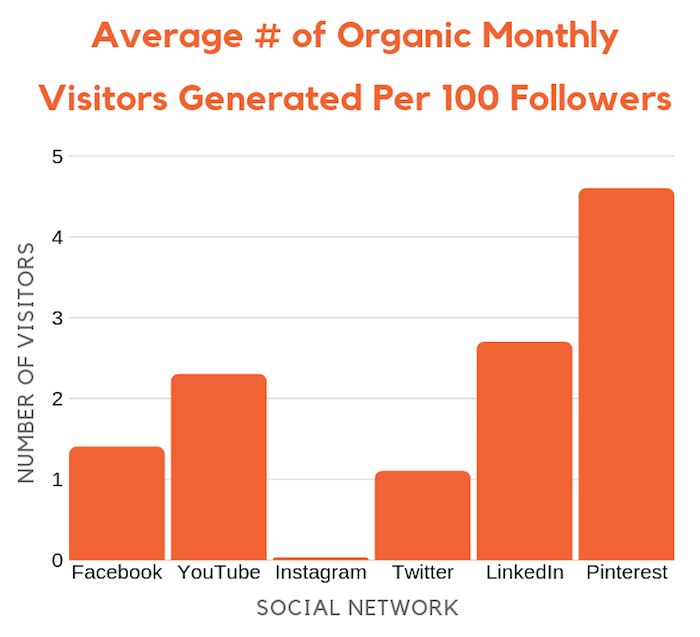
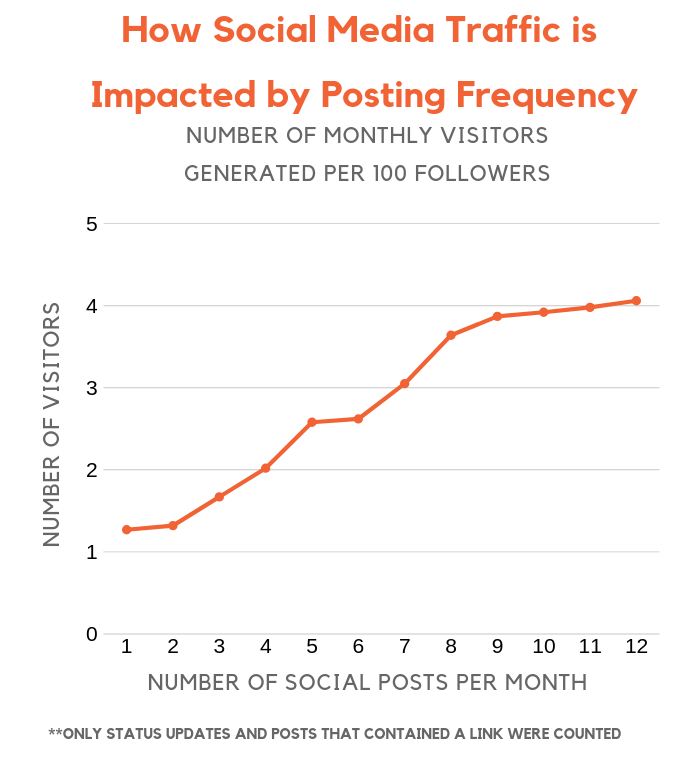
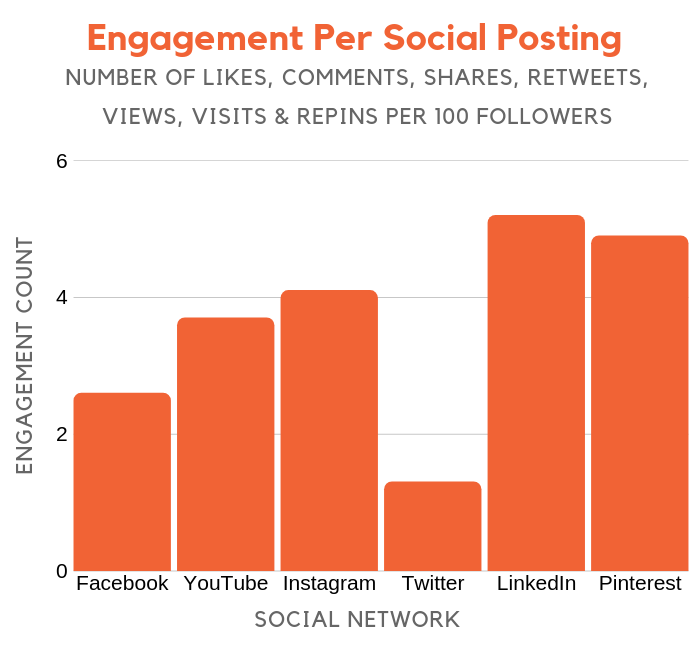
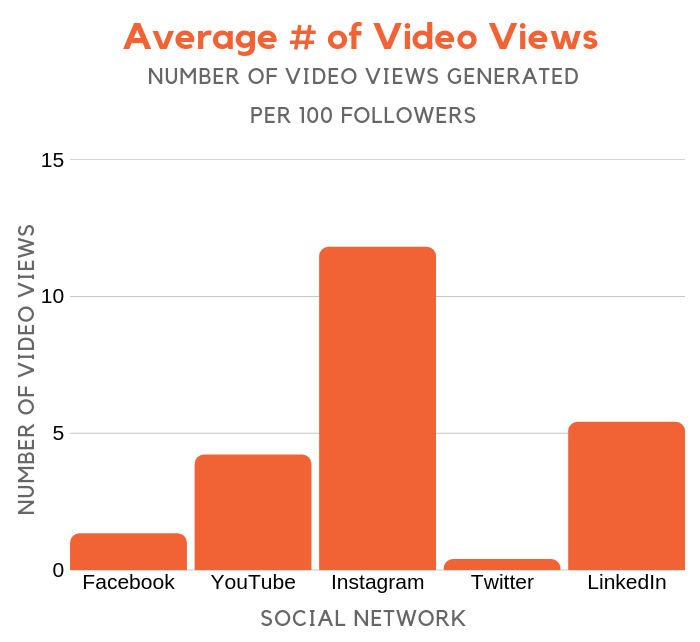
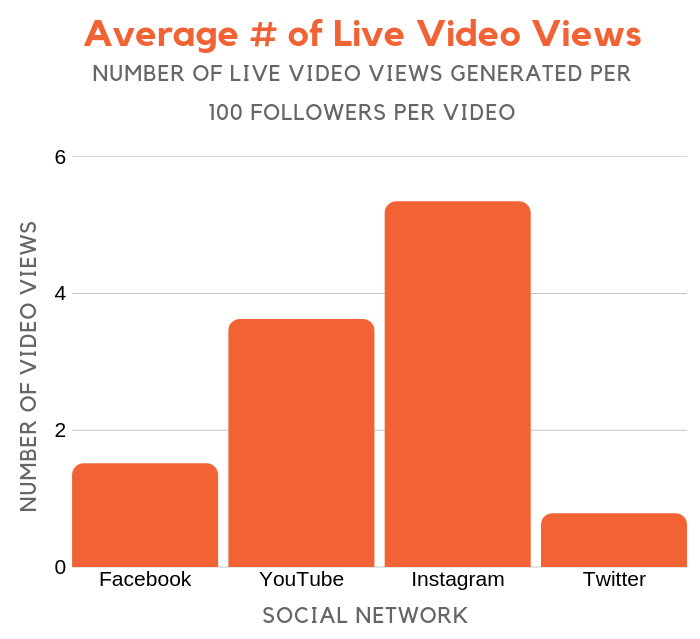
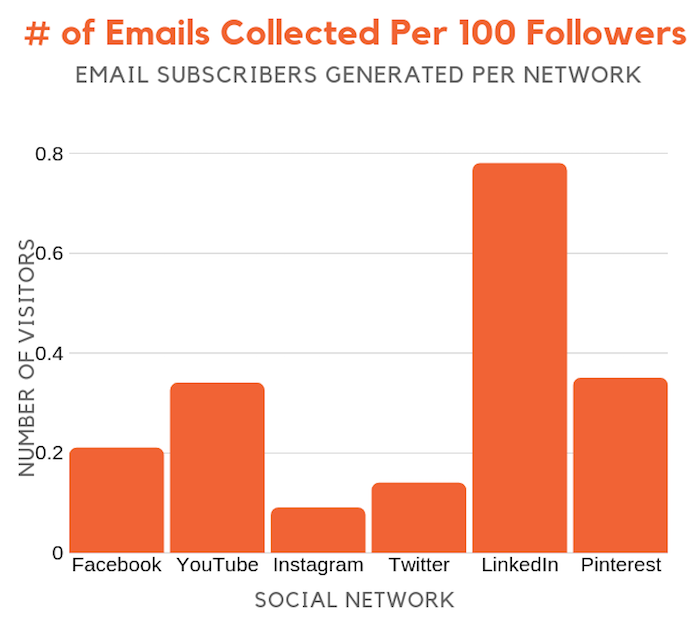
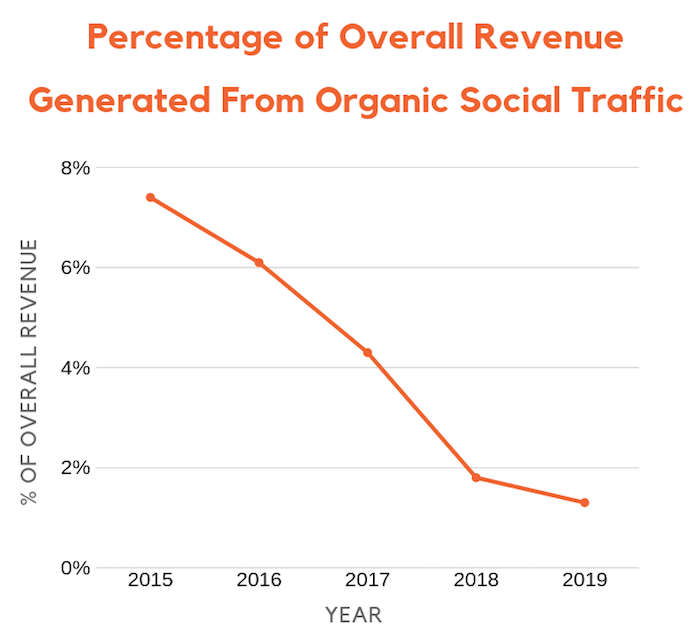
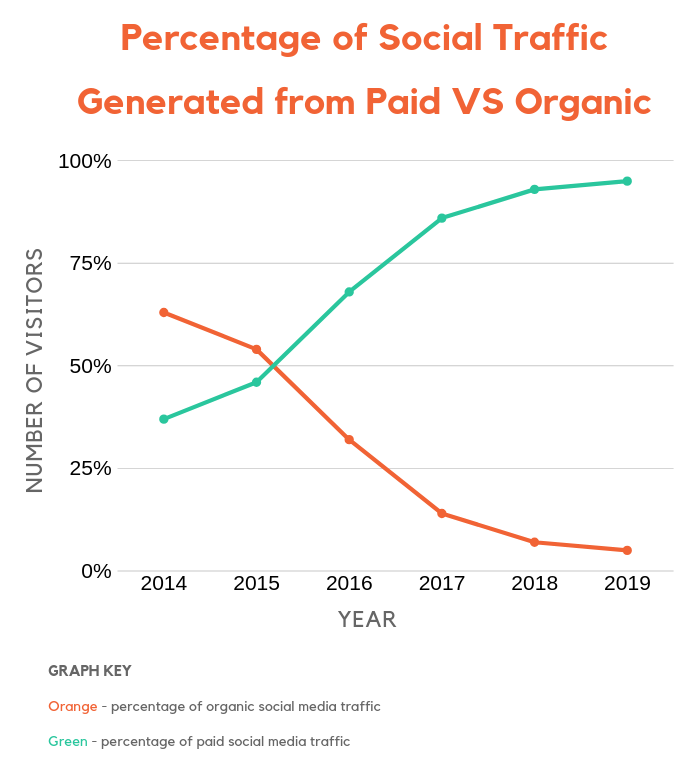
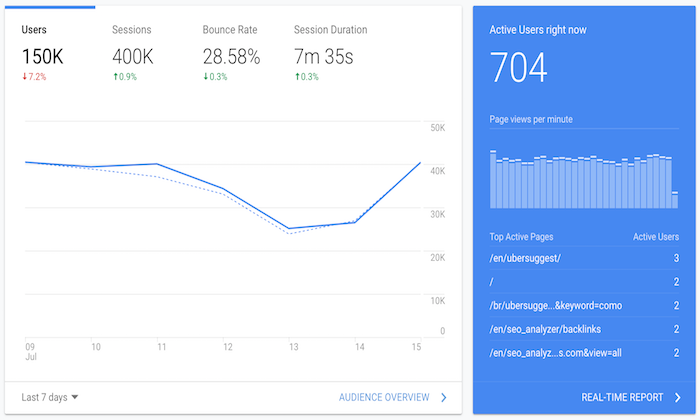
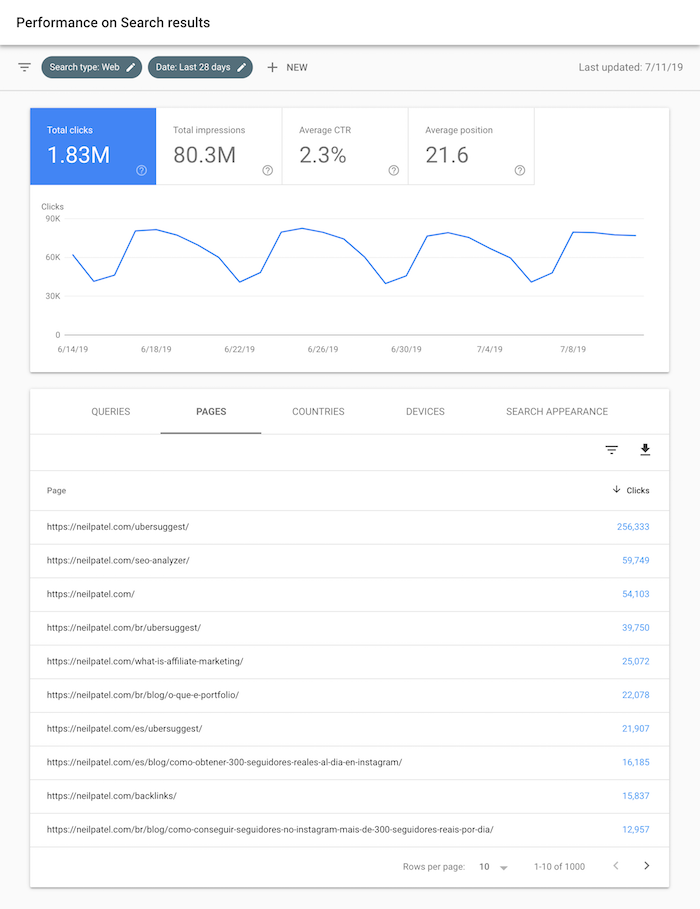
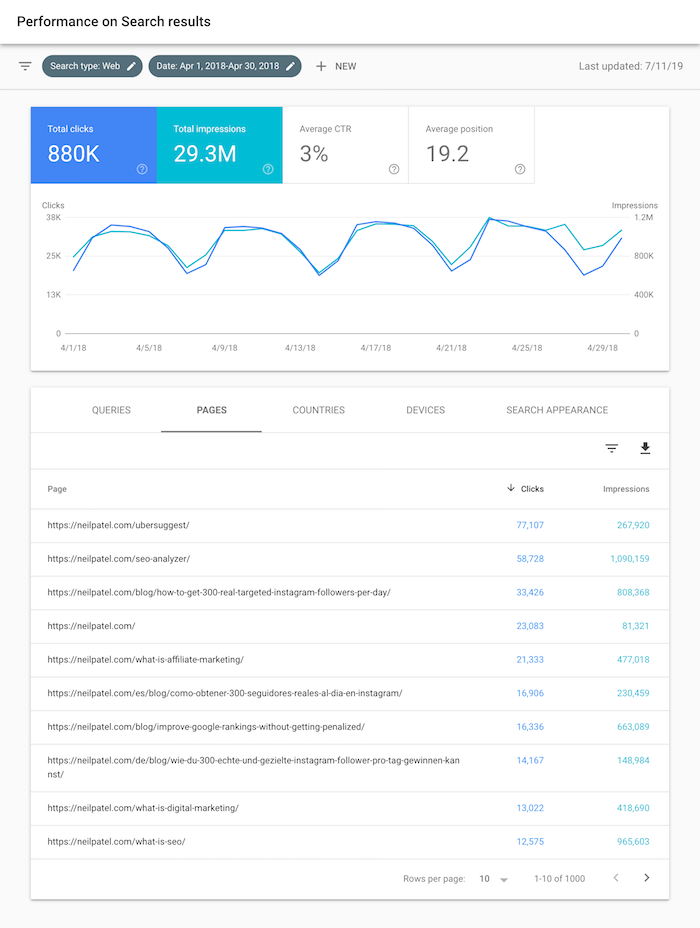
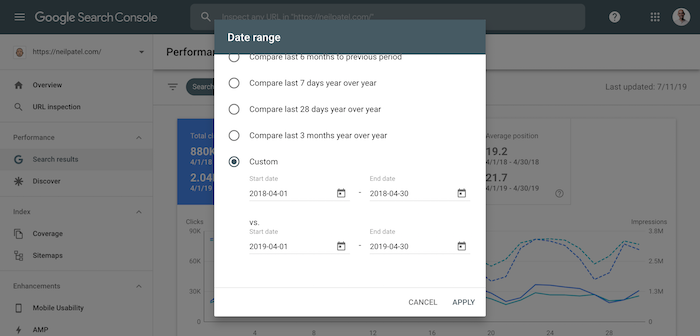
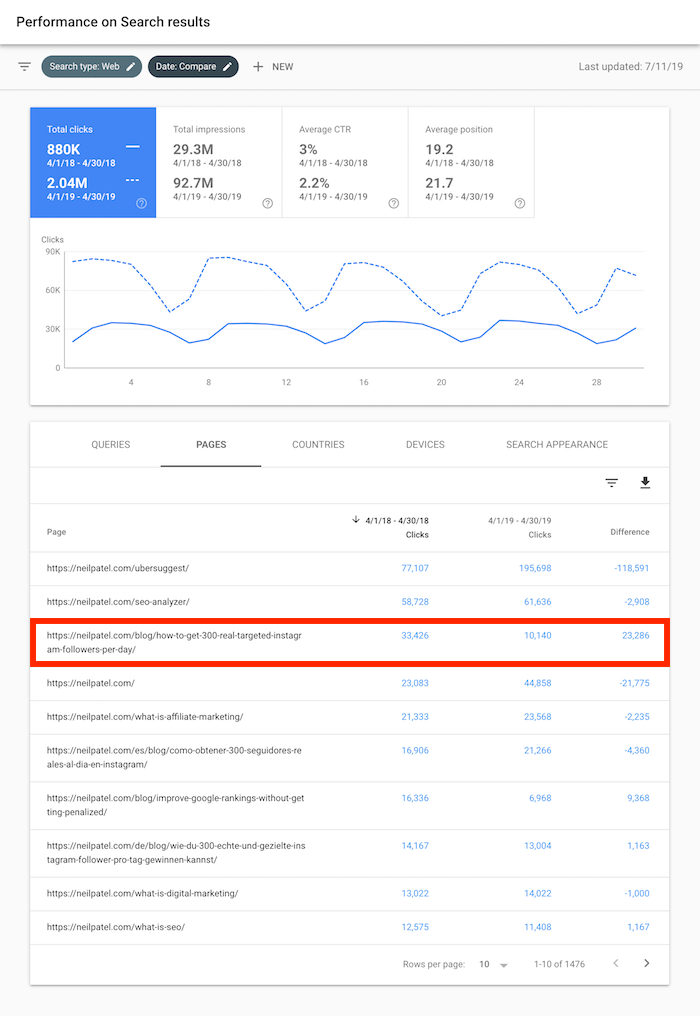
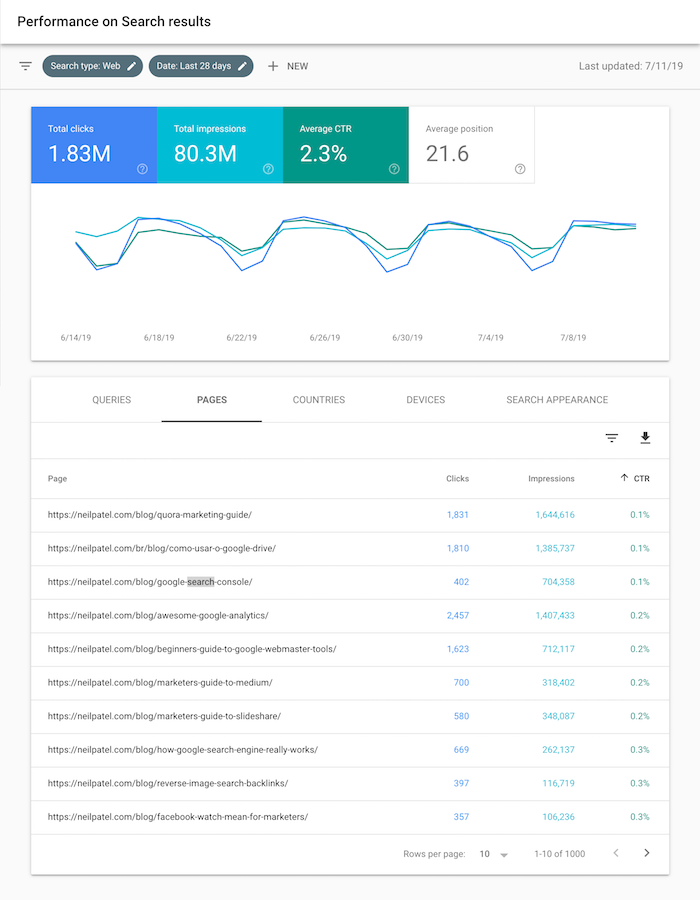
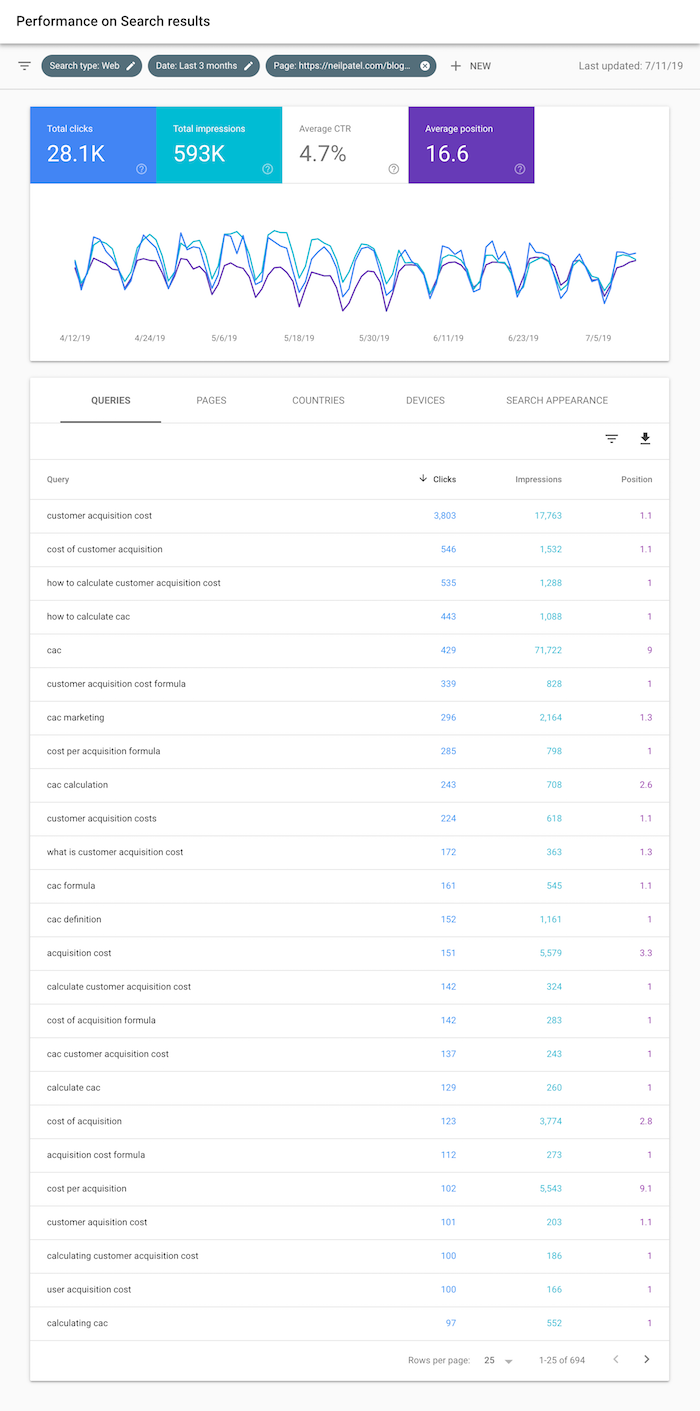
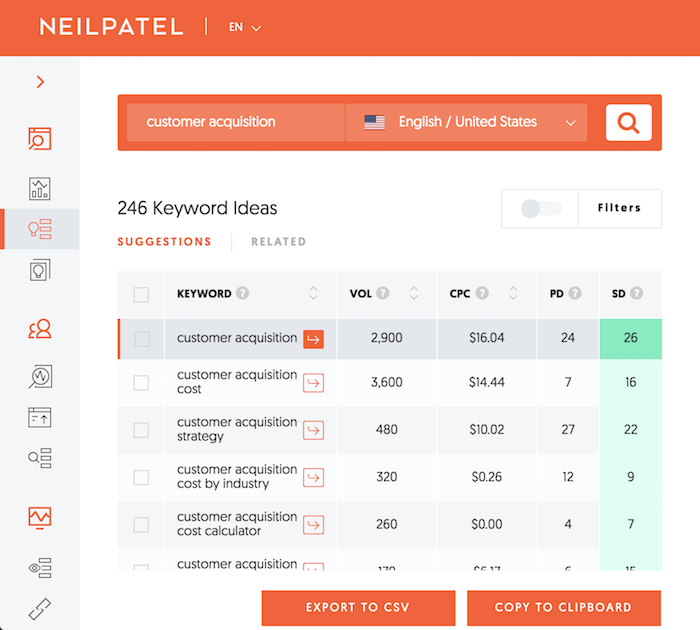
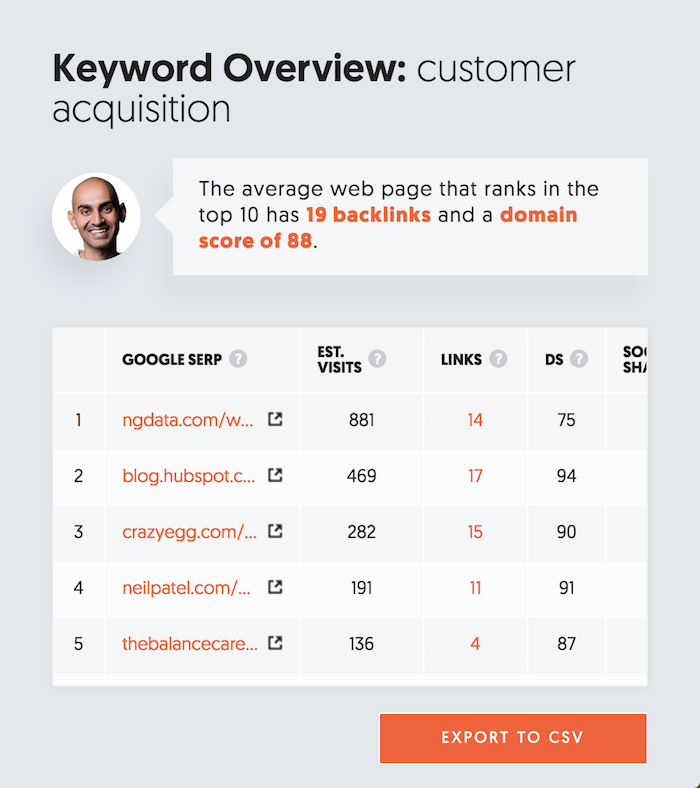
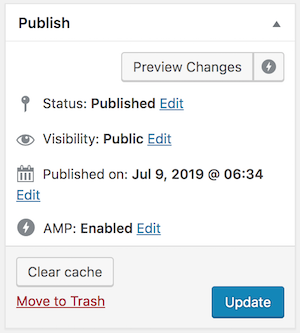


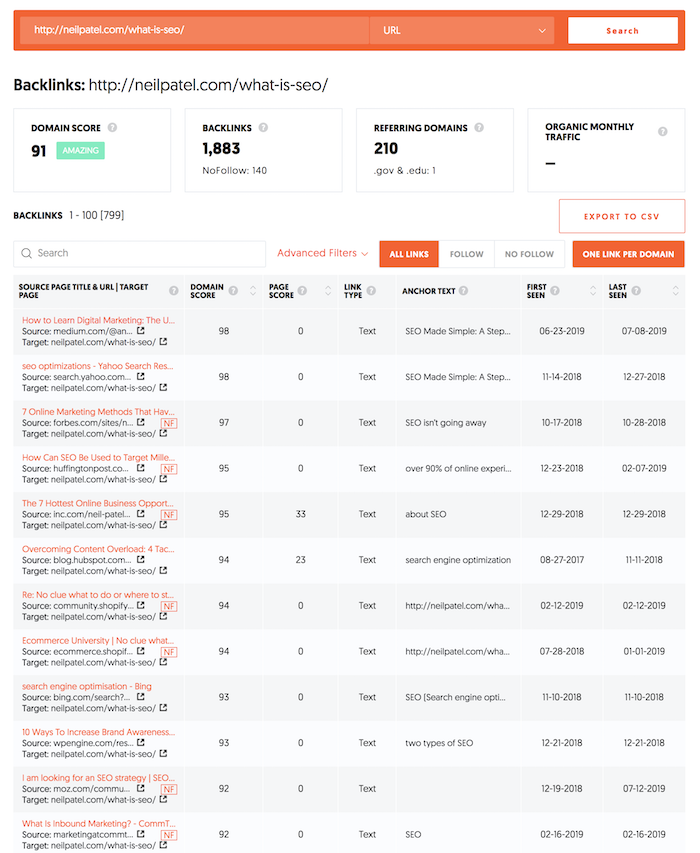
 RSS Feed
